PROTECTED SOURCE SCRIPT
OB EMA Fibo Tunnel
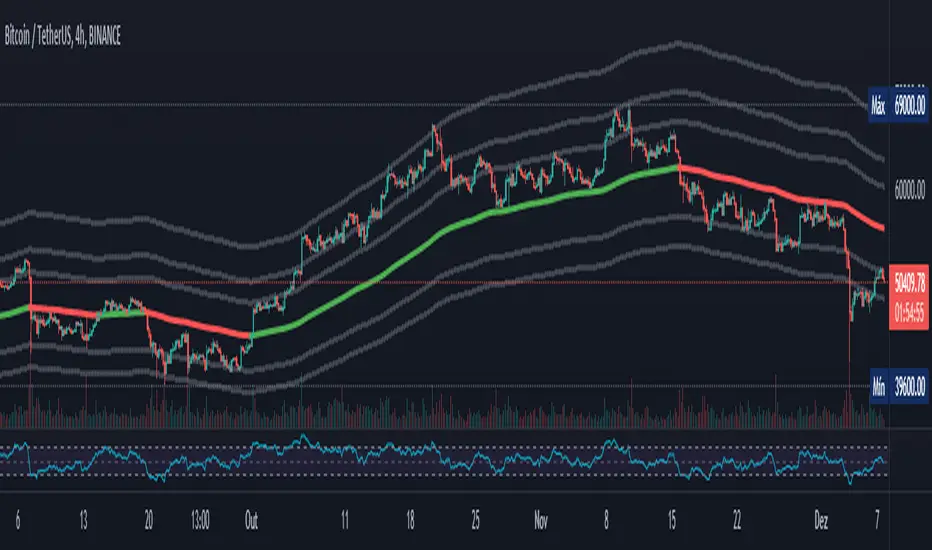
This indicator plots a base EMA and then plot many lines above and below according to the Fibonacci levels, creating a tunnel where it is possible to see the price respecting some levels.
It is similar the concept of Vegas Tunnel, but with my numbers.
The Base EMA is 26 for daily charts and 8 for Weekly charts. The smaller timeframes use a variation of 26, like 26*4 for 4h charts.
It is also possible to choose if you want to color candle bars and what levels of Fibo lines you want to see. I created that to have a clean chart.
*** To enable the colored candles, you should choose the visual order and move to top!
Please leave a comment if you liked and if you have any suggestion.
保護スクリプト
このスクリプトのソースコードは非公開で投稿されています。 ただし、制限なく自由に使用できます – 詳細はこちらでご確認ください。
免責事項
この情報および投稿は、TradingViewが提供または推奨する金融、投資、トレード、その他のアドバイスや推奨を意図するものではなく、それらを構成するものでもありません。詳細は利用規約をご覧ください。
保護スクリプト
このスクリプトのソースコードは非公開で投稿されています。 ただし、制限なく自由に使用できます – 詳細はこちらでご確認ください。
免責事項
この情報および投稿は、TradingViewが提供または推奨する金融、投資、トレード、その他のアドバイスや推奨を意図するものではなく、それらを構成するものでもありません。詳細は利用規約をご覧ください。