INVITE-ONLY SCRIPT
更新済 Options Flow Intraday Sentiment
Script useful for Intraday Trading - which based on Options data loaded in background - is showing sentiment of Investors. Very often Options are forecasting and precedes moves that will happen later on derivatives like Futures Contracts. Due to its' nature, data is useful during Regular Trading Hours sessions ( RTH ).
We take into account Options Volume flow & Put/Call Ratio from Options. Data is based from dataset on Quandl and loaded to TradingView. Therefore data is normalized as per different factors we have different scale of received data. Then I apply calculations comparing PUT and CALL Volume, giving the biggest weight ratio to those Options which have nearest Expiration Date. Another condition taken into account is Type of Option: either In the Money, Out of Money or At the money. Last but not least for Options there is calculated risk, where those orderflow entries with lowest risk are having the biggest weight in calculation while those with highest risk - are having lower ratio. Risk is calculated based on delta factor (coming out of Options standard definitions).
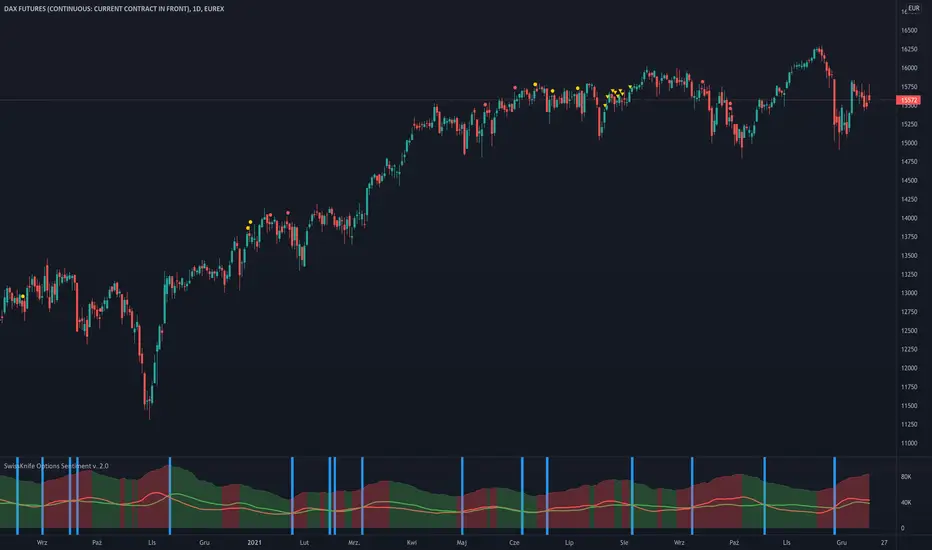
Background of indicator is coloured in direction of sentiment when we have alignment of sentiment factors calculated in background in one direction. Script is displaying additionally PUT Volume, CALL Volume from Options and PUT/CALL Ratio. Those are only additional information that can be useful for traders, but the whole logic is hidden under the hood (as described earlier) and is showing coloured background when sentiment is aligned. Therefore be prepared to take potentially a trade in direction of the background - but not blindly
Currently it's supporting SPX ( S&P500 ) and support for more instruments will come with next updates.
We take into account Options Volume flow & Put/Call Ratio from Options. Data is based from dataset on Quandl and loaded to TradingView. Therefore data is normalized as per different factors we have different scale of received data. Then I apply calculations comparing PUT and CALL Volume, giving the biggest weight ratio to those Options which have nearest Expiration Date. Another condition taken into account is Type of Option: either In the Money, Out of Money or At the money. Last but not least for Options there is calculated risk, where those orderflow entries with lowest risk are having the biggest weight in calculation while those with highest risk - are having lower ratio. Risk is calculated based on delta factor (coming out of Options standard definitions).
Background of indicator is coloured in direction of sentiment when we have alignment of sentiment factors calculated in background in one direction. Script is displaying additionally PUT Volume, CALL Volume from Options and PUT/CALL Ratio. Those are only additional information that can be useful for traders, but the whole logic is hidden under the hood (as described earlier) and is showing coloured background when sentiment is aligned. Therefore be prepared to take potentially a trade in direction of the background - but not blindly
Currently it's supporting SPX ( S&P500 ) and support for more instruments will come with next updates.
リリースノート
- added display and calculation of Balance Points - where Supply and Demand are balanced/equal based on the data from PUTs and CALLs read from Quandl dataset
- changed display of leading side on the market - green area represents dominating Bulls while Red - Bears
- script is now universally selecting in the background source of Options data based on instrument & chart on which it's placed; in case of unsupported instrument no data will appear
- script works best on D1 timeframe (due to changed logic of calculation Options data and its' ratios)
リリースノート
- added new display mode to display difference histogram between Supply and Demand instead of default view of Moving Average Lines
- Orange histogram shows dominance of Supply (Bearish Market) and Blue one represents dominance of Demand (Bullish Market)
リリースノート
- added alerts when Volume Flow switch from/to Bullish/Bearish
- modified visualisation of net difference between Volume of PUT and CALL Options
招待専用スクリプト
このスクリプトは作者が承認したユーザーのみアクセス可能です。使用するにはアクセス申請をして許可を得る必要があります。通常は支払い後に承認されます。詳細は下記の作者の指示に従うか、skyline-traderに直接お問い合わせください。
TradingViewは、作者を完全に信頼し、スクリプトの動作を理解していない限り、有料スクリプトの購入・使用を推奨しません。コミュニティスクリプトには無料のオープンソースの代替が多数あります。
作者の指示
免責事項
この情報および投稿は、TradingViewが提供または推奨する金融、投資、トレード、その他のアドバイスや推奨を意図するものではなく、それらを構成するものでもありません。詳細は利用規約をご覧ください。