OPEN-SOURCE SCRIPT
Renko Dots [racer8]
Description:
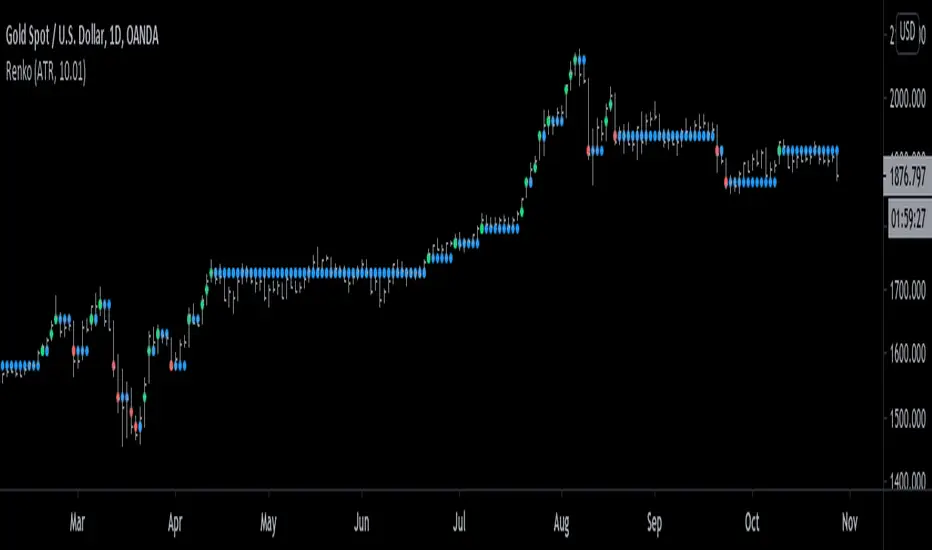
The idea behind this indicator is to have the Renko chart alongside with your main chart. What this indicator does is that it plots the values from the Renko Chart directly onto your main chart. So, you don't have to switch between Renko and OHLC charts anymore!
Parameters:
Renko Dots has to 2 parameters: Method & Length.
Method can be either Traditional or ATR. These are 2 different styles of Renko. Personally, I prefer ATR.
Length controls traditional Renko bar's fixed price range or controls the ATR period.
Signal Interpretation:
These Renko values are plotted as "Renko Dots" on your chart. The dots can be either green, red, or blue depending on market movements.
Green - new Renko bar (bullish)
Red - new Renko bar (bearish)
Blue - no new Renko bar (consolidation)
What is a Renko chart?
A Renko chart is a special chart that modifies a regular price chart's information about the close price and transforms it into Renko values that are plotted as Renko boxes on a chart. These boxes typically have a fixed range, say 10 pips for example. So if price moves at least 10 pips, a box is formed. Alternatively, the box's range can be set to the ATR....so in this case, each box represents a move of 1 ATR.
For more information on Renko charts, visit Investopedia.com, here's the link: investopedia.com/terms/r/renkochart.asp
Renko Dots' advantages over standard Renko chart:
- Can compare & apply it to other price charts (ohlc, candlesticks, line charts)
- Can apply it to other modified price charts (Heikin-Ashi, Renko, Line-Break)
- Can use it to trade alongside with the main chart
- Works across all instruments/markets and all time frames
- Plots consolidation (blue dots) ... (standard Renko doesn't consider time)
Enjoy :)
オープンソーススクリプト
TradingViewの精神に則り、このスクリプトの作者はコードをオープンソースとして公開してくれました。トレーダーが内容を確認・検証できるようにという配慮です。作者に拍手を送りましょう!無料で利用できますが、コードの再公開はハウスルールに従う必要があります。
免責事項
この情報および投稿は、TradingViewが提供または推奨する金融、投資、トレード、その他のアドバイスや推奨を意図するものではなく、それらを構成するものでもありません。詳細は利用規約をご覧ください。
オープンソーススクリプト
TradingViewの精神に則り、このスクリプトの作者はコードをオープンソースとして公開してくれました。トレーダーが内容を確認・検証できるようにという配慮です。作者に拍手を送りましょう!無料で利用できますが、コードの再公開はハウスルールに従う必要があります。
免責事項
この情報および投稿は、TradingViewが提供または推奨する金融、投資、トレード、その他のアドバイスや推奨を意図するものではなく、それらを構成するものでもありません。詳細は利用規約をご覧ください。