INVITE-ONLY SCRIPT
更新済 Spartan
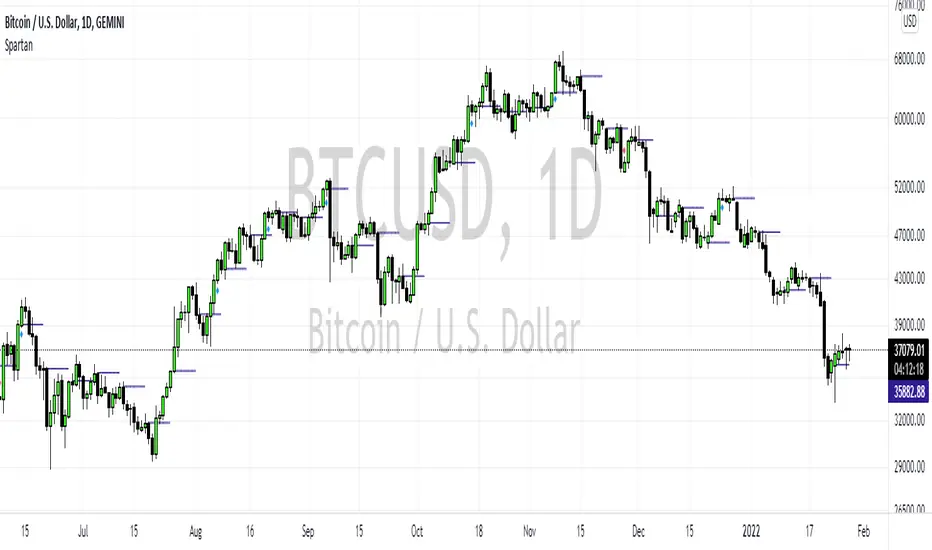
The Spartan Strategy.
This is a momentum strategy which attempts to identify when buying pressure or selling pressure is present in the markets.
How to trade the long side:
Once a blue candle appears, enter Long on pullbacks into a blue candle for longs
Place your stop loss on the opposite side of the blue candle.
Target a previous high for longs
How to trade the short side:
Once a red candle appears, enter Short on pullbacks into a red candle for shorts
Place your stop on the opposite side of the red candle.
Target a previous low for shorts
リリースノート
Adds strong buy and sell zones to script. リリースノート
Removes red line from chart image. リリースノート
Adds the following features:Support and Resistance levels shown as:
- Previous Day Highs/Lows
- Previous Week Highs/Lows
- Previous Month Highs/Lows
リリースノート
Removes daily / weekly / monthly levels as it makes chart too congested. リリースノート
Assigns grades to strong buying and strong selling pressure. A blue candle combined with a blue circle = High Strength Buying Pressure.
A blue candle combined with a orange circle = Medium Strength Buying Pressure.
A blue candle combined with a yellow circle = Low Strength Buying Pressure.
A red candle combined with a red circle = High Strength Selling Pressure.
A red candle combined with a orange circle = Medium Strength Selling Pressure.
A red candle combined with a yellow circle = Low Strength Selling Pressure.
リリースノート
Removed colors招待専用スクリプト
このスクリプトは作者が承認したユーザーのみアクセス可能です。使用するにはアクセス申請をして許可を得る必要があります。通常は支払い後に承認されます。詳細は下記の作者の指示に従うか、LiquidityTrackerに直接お問い合わせください。
TradingViewは、作者を完全に信頼し、スクリプトの動作を理解していない限り、有料スクリプトの購入・使用を推奨しません。コミュニティスクリプトには無料のオープンソースの代替が多数あります。
作者の指示
contact me via trading view messages
免責事項
この情報および投稿は、TradingViewが提供または推奨する金融、投資、トレード、その他のアドバイスや推奨を意図するものではなく、それらを構成するものでもありません。詳細は利用規約をご覧ください。
招待専用スクリプト
このスクリプトは作者が承認したユーザーのみアクセス可能です。使用するにはアクセス申請をして許可を得る必要があります。通常は支払い後に承認されます。詳細は下記の作者の指示に従うか、LiquidityTrackerに直接お問い合わせください。
TradingViewは、作者を完全に信頼し、スクリプトの動作を理解していない限り、有料スクリプトの購入・使用を推奨しません。コミュニティスクリプトには無料のオープンソースの代替が多数あります。
作者の指示
contact me via trading view messages
免責事項
この情報および投稿は、TradingViewが提供または推奨する金融、投資、トレード、その他のアドバイスや推奨を意図するものではなく、それらを構成するものでもありません。詳細は利用規約をご覧ください。