OPEN-SOURCE SCRIPT
更新済 Correlation with Averages
The "Correlation with Averages" indicator is designed to visualize and analyze the correlation between a selected asset's price and a base symbol's price, such as the S&P 500 (SPY). This indicator allows users to evaluate how closely an asset’s price movements align with those of the base symbol over various time periods, providing insights into market trends and potential portfolio adjustments.
Key Features:
Base Symbol and Correlation Period:
Users can specify the base symbol (default is SPY) and the period for correlation measurement (default is 252 trading days, approximating one year).
Correlation Calculation:
The indicator computes the correlation between the asset’s closing price and the base symbol’s closing price for the defined period.
Visualization:
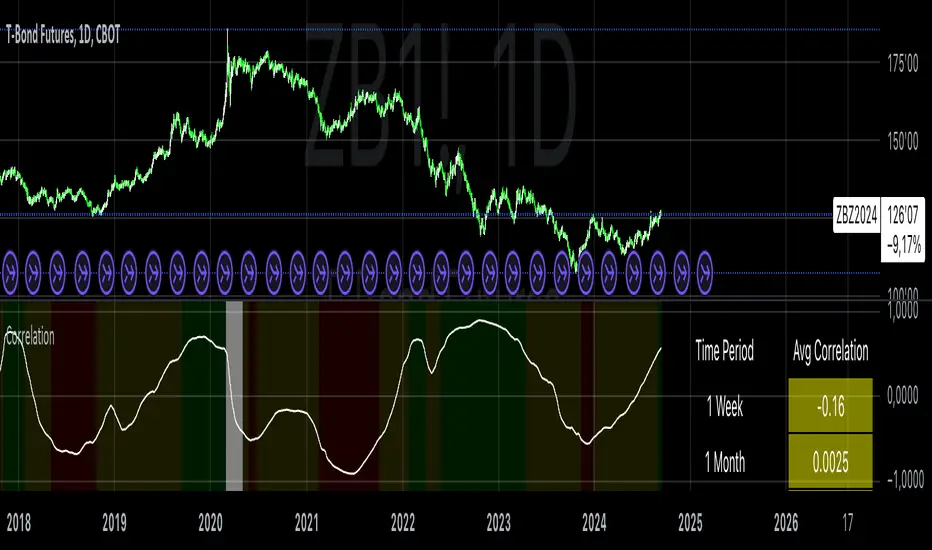
The correlation value is plotted on the chart, with conditional background colors indicating the strength and direction of the correlation:
Red for negative correlation (below -0.5)
Green for positive correlation (above 0.5)
Yellow for neutral correlation (between -0.5 and 0.5)
Average Correlation Over Time:
Average correlations are calculated and displayed for various periods: one week, one month, one year, and five years.
A table on the chart provides dynamic updates of these average values with color-coded backgrounds to indicate correlation strength.
The Role of Correlation in Portfolio Management
Correlation is a crucial concept in portfolio management because it measures the degree to which two securities move in relation to each other. Understanding correlation helps investors construct diversified portfolios that balance risk and return. Here's why correlation is important:
Diversification:
By including assets with low or negative correlation in a portfolio, investors can reduce overall portfolio volatility and risk. For instance, if one asset is negatively correlated with another, when one performs poorly, the other may perform well, thus smoothing the overall returns.
Risk Management:
Correlation analysis helps in identifying the potential impact of one asset’s performance on the entire portfolio. Assets with high correlation can lead to concentrated risk, while those with low correlation offer better risk management.
Performance Analysis:
Correlation measures the degree to which asset returns move together. This can inform strategic decisions, such as whether to adjust positions based on expected market conditions.
Scientific References
Markowitz, H. M. (1952). "Portfolio Selection." Journal of Finance, 7(1), 77-91.
This foundational paper introduced Modern Portfolio Theory, highlighting the importance of diversification and correlation in reducing portfolio risk.
Jorion, P. (2007). Financial Risk Manager Handbook. Wiley.
This handbook provides an in-depth exploration of risk management techniques, including the use of correlation in portfolio management.
Elton, E. J., Gruber, M. J., Brown, S. J., & Goetzmann, W. N. (2014). Modern Portfolio Theory and Investment Analysis. Wiley.
This book elaborates on the concepts of correlation and diversification, offering practical insights into portfolio construction and risk management.
By utilizing the "Correlation with Averages" indicator, traders and portfolio managers can make informed decisions based on the relationship between asset prices and the base symbol, ultimately enhancing their investment strategies.
Key Features:
Base Symbol and Correlation Period:
Users can specify the base symbol (default is SPY) and the period for correlation measurement (default is 252 trading days, approximating one year).
Correlation Calculation:
The indicator computes the correlation between the asset’s closing price and the base symbol’s closing price for the defined period.
Visualization:
The correlation value is plotted on the chart, with conditional background colors indicating the strength and direction of the correlation:
Red for negative correlation (below -0.5)
Green for positive correlation (above 0.5)
Yellow for neutral correlation (between -0.5 and 0.5)
Average Correlation Over Time:
Average correlations are calculated and displayed for various periods: one week, one month, one year, and five years.
A table on the chart provides dynamic updates of these average values with color-coded backgrounds to indicate correlation strength.
The Role of Correlation in Portfolio Management
Correlation is a crucial concept in portfolio management because it measures the degree to which two securities move in relation to each other. Understanding correlation helps investors construct diversified portfolios that balance risk and return. Here's why correlation is important:
Diversification:
By including assets with low or negative correlation in a portfolio, investors can reduce overall portfolio volatility and risk. For instance, if one asset is negatively correlated with another, when one performs poorly, the other may perform well, thus smoothing the overall returns.
Risk Management:
Correlation analysis helps in identifying the potential impact of one asset’s performance on the entire portfolio. Assets with high correlation can lead to concentrated risk, while those with low correlation offer better risk management.
Performance Analysis:
Correlation measures the degree to which asset returns move together. This can inform strategic decisions, such as whether to adjust positions based on expected market conditions.
Scientific References
Markowitz, H. M. (1952). "Portfolio Selection." Journal of Finance, 7(1), 77-91.
This foundational paper introduced Modern Portfolio Theory, highlighting the importance of diversification and correlation in reducing portfolio risk.
Jorion, P. (2007). Financial Risk Manager Handbook. Wiley.
This handbook provides an in-depth exploration of risk management techniques, including the use of correlation in portfolio management.
Elton, E. J., Gruber, M. J., Brown, S. J., & Goetzmann, W. N. (2014). Modern Portfolio Theory and Investment Analysis. Wiley.
This book elaborates on the concepts of correlation and diversification, offering practical insights into portfolio construction and risk management.
By utilizing the "Correlation with Averages" indicator, traders and portfolio managers can make informed decisions based on the relationship between asset prices and the base symbol, ultimately enhancing their investment strategies.
リリースノート
The "Correlation with Averages including Recession Periods" indicator is designed to measure the correlation between a user-selected base asset (e.g., the S&P 500) and another financial asset across different time frames. Additionally, it provides a specialized feature that calculates correlation specifically during recession periods, using data from the FREDindicator, which identifies U.S. recessions. When the value of FRED:USREC is greater than 1, the script marks that period as a recession and highlights it with a white background on the chart.
The indicator offers:
Correlation over Multiple Time Frames: It measures the correlation between the chosen asset and a base asset over several distinct time periods: 1 week, 1 month, 1 year, and 5 years.
Recession-Specific Correlation: An additional column in the displayed table shows how the correlation behaves specifically during recession periods. This allows investors to see whether correlations between assets change under economic stress conditions.
The Importance of Correlation in Portfolio Management
Correlation is a statistical measure that expresses how two assets move in relation to each other. In portfolio management, understanding correlations is crucial because it helps in the construction of a diversified portfolio, which can mitigate risk while maximizing returns. According to modern portfolio theory (MPT) introduced by Harry Markowitz (1952), assets with lower correlations to each other tend to create more efficient portfolios by reducing overall portfolio risk without sacrificing returns. When assets are less correlated, the chances of simultaneous losses across all portfolio components are minimized.
During recessions or economic downturns, correlations between assets can shift dramatically. For instance, correlations between stocks may rise, as nearly all assets become more aligned due to systemic shocks in the market (Longin & Solnik, 2001). This phenomenon—referred to as "correlation breakdown" during extreme market conditions—can undermine diversification strategies if not accounted for. Therefore, it becomes imperative to monitor correlations during both normal and recessionary periods.
Academic Perspective on Correlation:
Campbell, Koedijk, and Kofman (2002) found that during volatile markets, particularly during economic downturns, correlations between global equities tend to increase, making it harder for international diversification to provide the same risk reduction as in normal periods.
Engle (2002) introduced the DCC-GARCH model, which allows for the dynamic measurement of correlation changes over time, reinforcing the idea that asset correlations are not static and evolve under different economic environments.
How Users Can Optimize Their Portfolios Using This Indicator
Investors can use this indicator to improve portfolio optimization in several ways:
Assessing Asset Correlation Across Time Frames: By evaluating correlations across different time frames (1 week, 1 month, 1 year, 5 years), users can understand the consistency or variability of an asset's correlation with a base asset (e.g., the S&P 500). This helps in determining whether the asset can contribute to portfolio diversification over the short term or long term.
Understanding Correlation During Recessions: The recession-specific correlation feature allows users to analyze how assets behave under economic stress. If an asset shows low correlation during a recession, it may serve as a good hedge or defensive asset. Conversely, assets with high correlations during recessions may not provide as much risk reduction as expected when they are needed most.
Dynamic Risk Management: By monitoring the correlations dynamically, including during recessions, users can adjust their portfolios more responsively. For example, if correlations between risky assets like equities increase during a recession, investors might consider shifting into less correlated asset classes (e.g., bonds or commodities) to maintain diversification.
Strategic Asset Allocation: This indicator helps users in strategic asset allocation by identifying assets that maintain low correlations across various market conditions. Over time, assets with low or negative correlations with the rest of the portfolio can reduce risk without sacrificing potential returns.
Conclusion
By incorporating both normal market conditions and recession periods, the "Correlation with Averages including Recession Periods" indicator provides a nuanced tool for investors looking to optimize their portfolios. With the insights provided by this indicator, users can better navigate periods of market stress, adjust their portfolio allocations dynamically, and achieve better risk-adjusted returns.
References:
Markowitz, H. (1952). Portfolio selection. The Journal of Finance, 7(1), 77–91.
Longin, F., & Solnik, B. (2001). Extreme correlation of international equity markets. The Journal of Finance, 56(2), 649–676.
Campbell, R., Koedijk, K., & Kofman, P. (2002). Increased correlation in bear markets. Financial Analysts Journal, 58(1), 87–94.
Engle, R. (2002). Dynamic conditional correlation: A simple class of multivariate GARCH models. Journal of Business & Economic Statistics, 20(3), 339-350.
リリースノート
The Correlation Indicator in Pine Script™ is designed to calculate and display the correlation between a chosen asset and a base symbol (default: S&P 500 via "SPY") over various time periods. Additionally, it incorporates recession data from the Federal Reserve Economic Data (FRED) to provide context for performance during economic downturns. This indicator is particularly useful for analyzing the relationship between an asset and a benchmark, helping investors gauge how their asset's performance aligns with broader market movements.Key Functions:
Correlation Calculation:
The indicator calculates the correlation between the user-selected asset's closing price and the base symbol over multiple time periods (1 week, 1 month, 1 year, and 5 years).
Correlation values range from -1 to +1, where +1 indicates a perfect positive correlation, -1 indicates a perfect negative correlation, and 0 indicates no correlation.
Recession Analysis:
The script integrates data from the FRED indicator to highlight recessionary periods. This is visually represented on the chart, with a conditional background color.
It calculates the performance of both the selected asset and the base symbol during these recession periods, allowing for comparison.
Performance Metrics:
Performance during recession periods is measured as a percentage change in price from the start to the end of the recession for both the selected asset and the base symbol. Positive performance is highlighted in green, and negative performance in red.
Dynamic Table Display:
The indicator outputs a table displaying the average correlation over different time periods, along with performance metrics during recession periods. The table dynamically updates as new data becomes available.
Importance of Correlation in Portfolio Management
Correlation is a key concept in modern portfolio theory, essential for managing risk and optimizing returns. It measures how two assets move relative to one another, which is crucial in constructing diversified portfolios that aim to maximize returns while minimizing risk.
Risk Management:
By combining assets with low or negative correlation, investors can reduce overall portfolio volatility. When one asset underperforms, another may outperform, thus stabilizing returns. Studies show that diversifying across uncorrelated or negatively correlated assets is effective in managing risk .
Efficient Frontier and Diversification:
Modern portfolio theory, pioneered by Harry Markowitz in the 1950s, emphasizes the importance of diversification and the "efficient frontier" — a curve that represents the best possible return for a given level of risk. The concept is based on selecting assets with varying correlations .
By analyzing correlation, investors can adjust the composition of their portfolios to stay on the efficient frontier, ensuring an optimal risk-return trade-off .
Impact of Market Phases:
Correlation tends to fluctuate during different market conditions, especially during economic downturns or recessions. Studies show that correlations between risky assets tend to increase during market crashes, limiting the effectiveness of diversification during those periods .
This indicator helps investors monitor how correlations change over time, particularly during recessions, which can provide insights into potential adjustments needed for portfolio hedging.
Strategic Asset Allocation:
Long-term investors often use correlation analysis to determine strategic asset allocation — balancing investments across asset classes like equities, bonds, and commodities. The correlation between these asset classes changes over time, and continuous monitoring helps investors adjust their portfolio to changing economic environments .
In summary, understanding and using correlation is fundamental in portfolio management. It not only helps in achieving diversification but also assists in optimizing risk and return, making it a crucial tool for long-term investment strategies.
オープンソーススクリプト
TradingViewの精神に則り、このスクリプトの作者はコードをオープンソースとして公開してくれました。トレーダーが内容を確認・検証できるようにという配慮です。作者に拍手を送りましょう!無料で利用できますが、コードの再公開はハウスルールに従う必要があります。
Where others speculate, we systematize.
edgetools.org
edgetools.org
免責事項
この情報および投稿は、TradingViewが提供または推奨する金融、投資、トレード、その他のアドバイスや推奨を意図するものではなく、それらを構成するものでもありません。詳細は利用規約をご覧ください。