OPEN-SOURCE SCRIPT
Price strength around MA
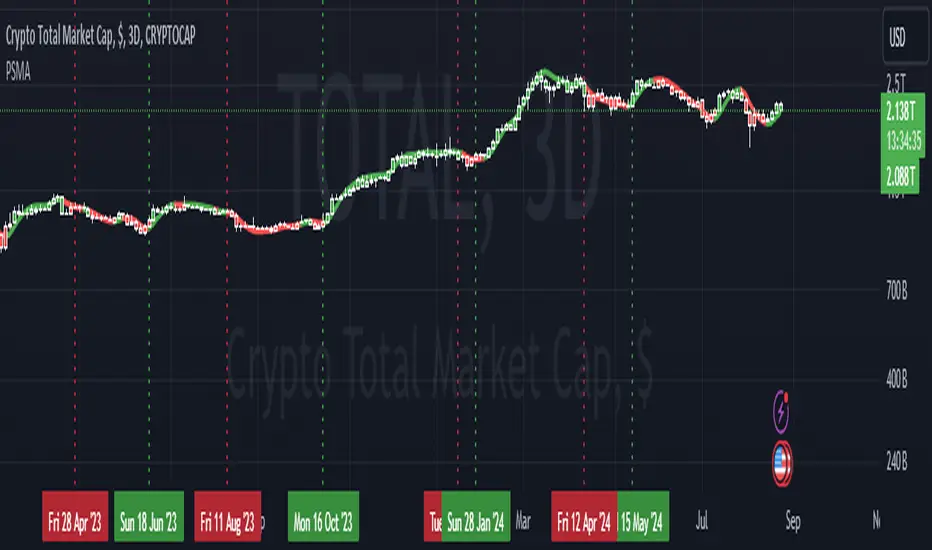
This indicatorit takes the HMA and calculates the difference between close and HMA. Within a lookback period it adds all values together where price is above/below the HMA. However, it squares the values before adding them together, so that larger differences have a bigger impact (this is to detect breakouts). After that it subtracts all the negative values from the positive ones so that in the end we have one single number that represents price behavior in the lookback period. This number is then added to the difference between an EMA and a SMA to produce the final signal of this indicator.
オープンソーススクリプト
TradingViewの精神に則り、このスクリプトの作者はコードをオープンソースとして公開してくれました。トレーダーが内容を確認・検証できるようにという配慮です。作者に拍手を送りましょう!無料で利用できますが、コードの再公開はハウスルールに従う必要があります。
免責事項
この情報および投稿は、TradingViewが提供または推奨する金融、投資、トレード、その他のアドバイスや推奨を意図するものではなく、それらを構成するものでもありません。詳細は利用規約をご覧ください。
オープンソーススクリプト
TradingViewの精神に則り、このスクリプトの作者はコードをオープンソースとして公開してくれました。トレーダーが内容を確認・検証できるようにという配慮です。作者に拍手を送りましょう!無料で利用できますが、コードの再公開はハウスルールに従う必要があります。
免責事項
この情報および投稿は、TradingViewが提供または推奨する金融、投資、トレード、その他のアドバイスや推奨を意図するものではなく、それらを構成するものでもありません。詳細は利用規約をご覧ください。