PROTECTED SOURCE SCRIPT
Yield Curve Analyzer - Market Radar
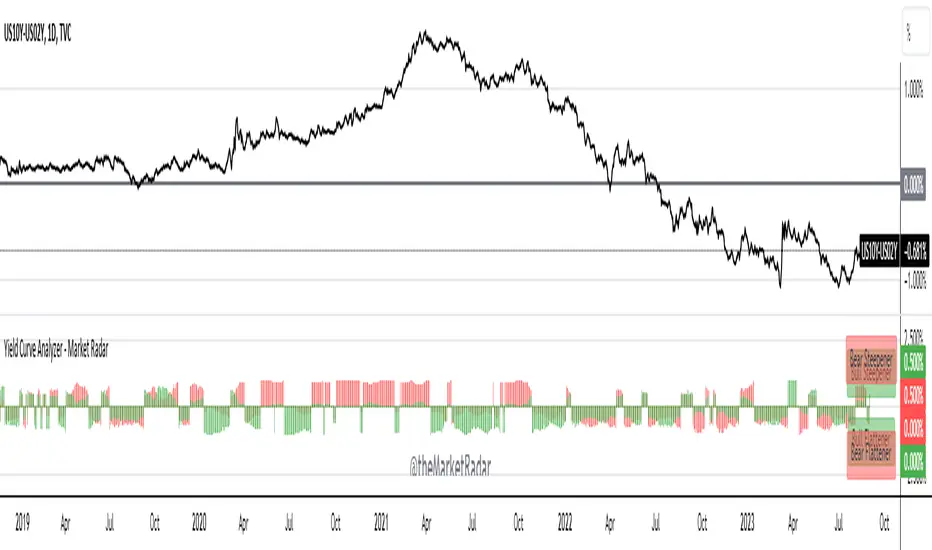
This is a script that gives insight into the types of moves that are happening across the yield curve. It helps in identifying both bull/bear steepeners and flatteners between two tenors.
The indicator displays data as a percentage of the steepeners and flatteners that have occurred over a short-term trailing window. This gives a reading that is more digestible with less noise.
Currently, the indicator only displays data for the 10Y-2Y US Treasury yield spread.
We intend to add additional spreads in the near future; such as 10Y-3M, 30Y-5Y, and 30Y-2Y.
保護スクリプト
このスクリプトのソースコードは非公開で投稿されています。 ただし、制限なく自由に使用できます – 詳細はこちらでご確認ください。
免責事項
この情報および投稿は、TradingViewが提供または推奨する金融、投資、トレード、その他のアドバイスや推奨を意図するものではなく、それらを構成するものでもありません。詳細は利用規約をご覧ください。
保護スクリプト
このスクリプトのソースコードは非公開で投稿されています。 ただし、制限なく自由に使用できます – 詳細はこちらでご確認ください。
免責事項
この情報および投稿は、TradingViewが提供または推奨する金融、投資、トレード、その他のアドバイスや推奨を意図するものではなく、それらを構成するものでもありません。詳細は利用規約をご覧ください。