INVITE-ONLY SCRIPT
更新済 Probability Pivot Points
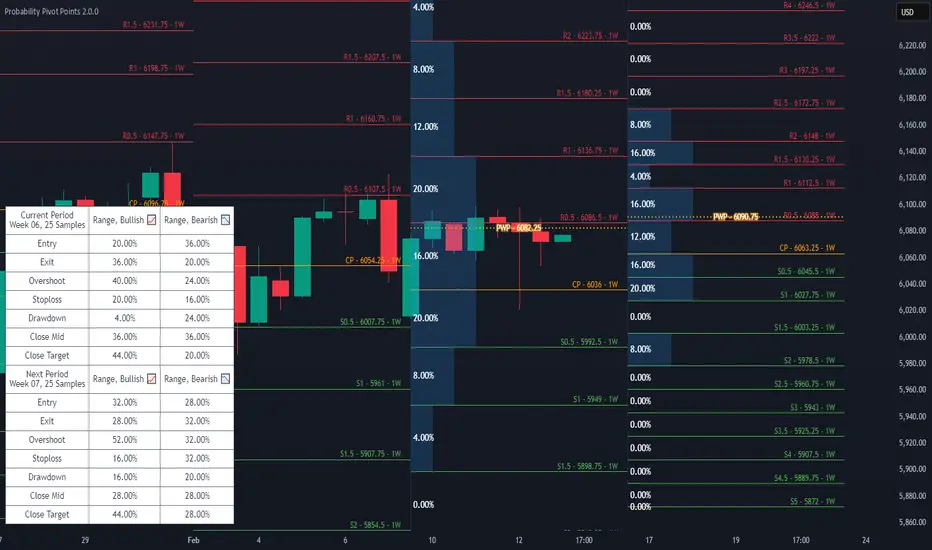
Probability Pivot Points integrates a customizable Pivot Points indicator with conditional probabilities calculated from historical occurrences.
Features
Six different discretionarily Pivot Point Bias strategies utilizing Midpoint Pivot Points in bullish and bearish variants: Standard, Range, Continuation, Counter Trend, Expansion, and Extension.


Next Period's Pivot Points given the current period's OHLC data. Includes settings to use theoretical OHLC values to see what the next period's Pivot Points could look like.


Supports Traditional, Floor, Fibonacci, and Average True Range Pivot Point calculations.

Includes settings to customize the Fibonacci ratios and Average True Range calculations.

Automatically maximize or manually set the number of historical Pivot Points to draw.

Probability visualizations for the Pivot Points based on historical occurrences for the current and upcoming trading periods. The Probability Weighted Pivot (PWP) Point uses the probabilities calculated as weights against every displayed Pivot Point to show a mean of the data.

Load seasonal or non-seasonal historical data to calculate the odds of a High, Low, or Close occurring between any two Pivot Points.

Settings to manually set the weekly, monthly, and quarterly seasonal data loaded into the Pivot Probabilities feature. Automatic detection and loading of the current seasonal period's data is the default behavior. Includes a table that displays the data that's loaded.

Get probabilities for the currently selected Pivot Point Bias strategy.

Check the odds of High, Low, or Close occurrences at the strategy's marked Entry, Exit, or Stop Loss Pivot Points.

Seasonal Filters let you select specific years to sample probabilities from.

Customize pivot colors, width, label size, label color, Bias Entry and Exit Zone colors, Pivot Probability colors, and pick between the Point Five and M Legacy Midpoint label styles.

Auto Timeframe changes the Pivot Points higher timeframe based on the chart timeframe in use. Includes settings to customize what chart timeframes will display specific Pivot Point higher timeframes.

Q: Is this an update to your older Pivot Probabilities indicator?
Pivot Probabilities was designed to require a separately applied Pivot Points indicator to be interpreted and used properly. Probability Pivot Points is designed with an included set of Pivot Pivots that can interact with the probability calculations, which helps make improvements to new calculations and visualizations that Pivot Probabilities was never originally designed to do. Features from Pivot Probabilities are being completely redesigned, reimplemented, and expanded upon as a component in this larger Probability Pivot Points indicator. Anyone with access to the old Pivot Probabilities will also get access to Probability Pivot Points and are considered part of the same package.
Features
Six different discretionarily Pivot Point Bias strategies utilizing Midpoint Pivot Points in bullish and bearish variants: Standard, Range, Continuation, Counter Trend, Expansion, and Extension.
Next Period's Pivot Points given the current period's OHLC data. Includes settings to use theoretical OHLC values to see what the next period's Pivot Points could look like.
Supports Traditional, Floor, Fibonacci, and Average True Range Pivot Point calculations.
Includes settings to customize the Fibonacci ratios and Average True Range calculations.
Automatically maximize or manually set the number of historical Pivot Points to draw.
Probability visualizations for the Pivot Points based on historical occurrences for the current and upcoming trading periods. The Probability Weighted Pivot (PWP) Point uses the probabilities calculated as weights against every displayed Pivot Point to show a mean of the data.
Load seasonal or non-seasonal historical data to calculate the odds of a High, Low, or Close occurring between any two Pivot Points.
Settings to manually set the weekly, monthly, and quarterly seasonal data loaded into the Pivot Probabilities feature. Automatic detection and loading of the current seasonal period's data is the default behavior. Includes a table that displays the data that's loaded.
Get probabilities for the currently selected Pivot Point Bias strategy.
Check the odds of High, Low, or Close occurrences at the strategy's marked Entry, Exit, or Stop Loss Pivot Points.
Seasonal Filters let you select specific years to sample probabilities from.
Customize pivot colors, width, label size, label color, Bias Entry and Exit Zone colors, Pivot Probability colors, and pick between the Point Five and M Legacy Midpoint label styles.
Auto Timeframe changes the Pivot Points higher timeframe based on the chart timeframe in use. Includes settings to customize what chart timeframes will display specific Pivot Point higher timeframes.
Q: Is this an update to your older Pivot Probabilities indicator?
Pivot Probabilities was designed to require a separately applied Pivot Points indicator to be interpreted and used properly. Probability Pivot Points is designed with an included set of Pivot Pivots that can interact with the probability calculations, which helps make improvements to new calculations and visualizations that Pivot Probabilities was never originally designed to do. Features from Pivot Probabilities are being completely redesigned, reimplemented, and expanded upon as a component in this larger Probability Pivot Points indicator. Anyone with access to the old Pivot Probabilities will also get access to Probability Pivot Points and are considered part of the same package.
リリースノート
Version 1.1.0This update adds a Strategy Dashboard, a Custom Pivot Bias option, and quarterly Pivot Probabilities.
Here is a breakdown of everything in the new Strategy Dashboard to help summarize descriptive statistics for each Pivot Bias strategy.
Includes new style settings to customize the color, font, location, and size of the dashboard. You can toggle what strategies and summary statistics to display here as well.
Under the Pivot Bias dropdown setting, you can now select "Custom" and create your own Pivot Bias. Select specific Pivot Points to display and set your own entry and exit locations.
Quarterly probabilities are now available. Switch to a weekly timeframe to automatically pull up a quarterly timeframe, or manually set the indicator to use a 3M timeframe.
リリースノート
Update for the indicator's chart preview!リリースノート
Version 1.1.1- 🆕 New Custom Bias Entry and Exit Zone inputs let you select the upper and lower pivots of the zone independently.
- 🔄 Moved the Probabilities Data Source input closer to the top of the Inputs tab.
リリースノート
Version 1.2.0- 🆕 Add Camarilla Pivot Point calculations.
- 🆕 Add Woodie Pivot Point calculations.
リリースノート
Version 1.2.1- 🐛 Fix an error that prevented the indicator from being applied to new chart layouts.
リリースノート
Version 2.0.0Update indicator to Pine Script™ V6 🎉 All Probability Pivot Point versions that use Pine Script™ V6 now start with 2.X.X.
Probability Pivot Points now includes alert options for individual Pivot Point levels, including the Probability Weighted Pivot.
Alternatively, create multiple alerts using a Pivot Point Bias strategy with the Any alert() function call condition. Which will create alerts for crossing into entry zones and exit zones exit zone, hitting the bias strategy's stop loss, and an optional alert for the Probability Weighted Pivot in the Pivot Probability settings.
Upgraded and simplified the Auto Timeframe settings. Same functionality with one less input and new fallbacks when set incorrectly.
招待専用スクリプト
このスクリプトは作者が承認したユーザーのみアクセス可能です。使用するにはアクセス申請をして許可を得る必要があります。通常は支払い後に承認されます。詳細は下記の作者の指示に従うか、joebausに直接お問い合わせください。
TradingViewは、作者を完全に信頼し、スクリプトの動作を理解していない限り、有料スクリプトの購入・使用を推奨しません。コミュニティスクリプトには無料のオープンソースの代替が多数あります。
作者の指示
Get access to the indicator through my Whop store at: https://whop.com/bausbenchmarks/ Message me directly on TradingView if you have any questions.
Joe Baus, bausbenchmarks.com
免責事項
この情報および投稿は、TradingViewが提供または推奨する金融、投資、トレード、その他のアドバイスや推奨を意図するものではなく、それらを構成するものでもありません。詳細は利用規約をご覧ください。