PROTECTED SOURCE SCRIPT
ASTA EMA (5, 13, 26, 50, 100, 200)
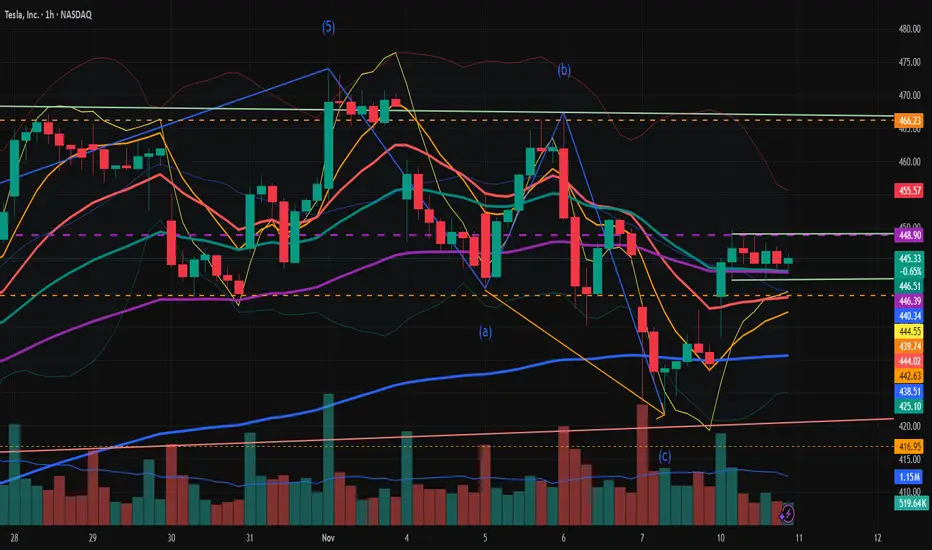
This indicator plots six Exponential Moving Averages (EMAs) — 5, 13, 26, 50, 100, and 200 — directly on the price chart. EMAs give more weight to recent price action, so they react faster than simple moving averages. Using multiple EMAs of varying lengths gives you both short-term and long-term trend information on a single chart:
Short EMAs (5, 13, 26) show rapid momentum and recent price direction.
Medium EMAs (50, 100) show intermediate trend context.
Long EMA (200) shows the major, long-term trend.
This setup is useful for trend identification, momentum signals, dynamic support/resistance, and crossover-based entry/exit signals.
保護スクリプト
このスクリプトのソースコードは非公開で投稿されています。 However, you can use it freely and without any limitations – learn more here.
免責事項
この情報および投稿は、TradingViewが提供または推奨する金融、投資、トレード、その他のアドバイスや推奨を意図するものではなく、それらを構成するものでもありません。詳細は利用規約をご覧ください。
保護スクリプト
このスクリプトのソースコードは非公開で投稿されています。 However, you can use it freely and without any limitations – learn more here.
免責事項
この情報および投稿は、TradingViewが提供または推奨する金融、投資、トレード、その他のアドバイスや推奨を意図するものではなく、それらを構成するものでもありません。詳細は利用規約をご覧ください。