PROTECTED SOURCE SCRIPT
更新済 Relative Strength MA Crossover [LevelUp]
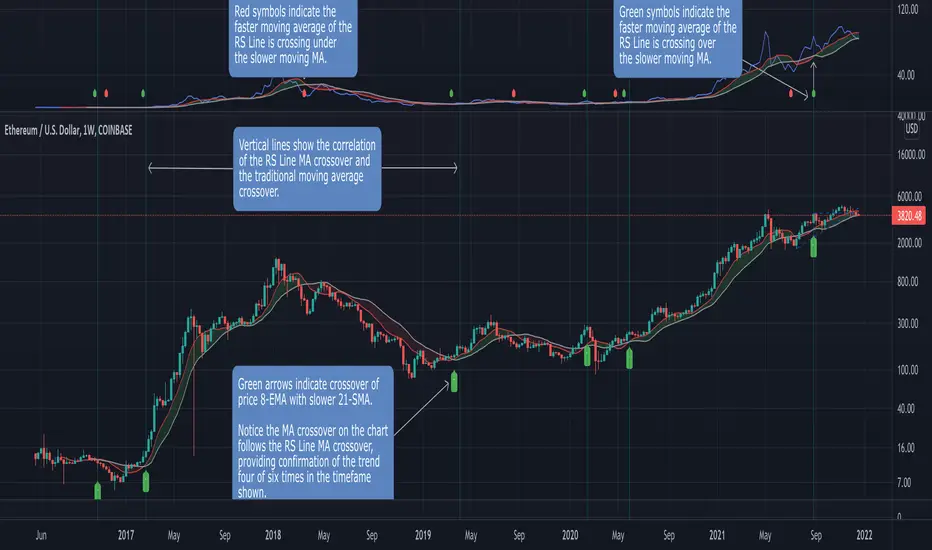
A popular technical analysis strategy is the moving average crossover. This indicator combines a crossover with the Relative Strength Line, created by William O’Neil. The RS Line is a tool used to compare the price action of a particular stock to that of an index, with the S&P 500 being the index preferred by O'Neil.
When one moving average crosses above or below another, that may be a signal of a trend change. For example, when a shorter-term moving average (aka faster moving average) of price moves up and through a longer-term moving average (aka slower moving average), it is likely the price is trending up, this is referred to as a crossover. The opposite can also be a potential signal of a change in the trend. When a shorter-term moving average crosses under a longer-term moving average, the price may be heading down. We refer to this as a negative crossover or crossunder.
This indicator allows configuration of up to two moving averages for the RS Line. Using two moving averages you can quickly identify the direction of the trend and also pinpoint where the faster moving average crosses over or under the slower moving average.
While beta testing this indicator, we performed a study using Bitcoin. In 2021 we’ve seen an increasing correlation of BTC and the S&P 500. This is most likely due to the fact that both crypto and stocks are riskier than other financial assets such as bonds and commodities. When the market is risk-off, both the S&P 500 and Bitcoin tend to sell off together.
For the BTC test case we used two moving averages of the RS Line, 8-EMA and 50-SMA. In the chart that follows you can see a breakdown of how this played out over the last ~2 years. A positive divergence is indicated by the 8-EMA of RS crossing above the 50-SMA, and vice versa for a negative divergence.

Here's another example using TSLA:

Features
■ Configure up to two moving averages for each timeframe.
■ Optional symbols indicate moving average crossovers.
■ Configure custom alerts on crossovers, for any timeframe.
■ Optional moving average cloud makes it easy to identify if slower moving average is above/below faster moving average.
■ Configurable index, defaulting to S&P 500 (SPX).
Acknowledgement
This project is a collaborative effort with blakedavis17 a Crypto-Equity Analyst. Based on a discussion with Blake about a moving average crossover using the RS Line, we created a simple indicator to explore the concept further. We were very encouraged with the results of backtesting and decided to publish the indicator as we believe it may be a helpful tool for both equity and crypto traders.
When one moving average crosses above or below another, that may be a signal of a trend change. For example, when a shorter-term moving average (aka faster moving average) of price moves up and through a longer-term moving average (aka slower moving average), it is likely the price is trending up, this is referred to as a crossover. The opposite can also be a potential signal of a change in the trend. When a shorter-term moving average crosses under a longer-term moving average, the price may be heading down. We refer to this as a negative crossover or crossunder.
This indicator allows configuration of up to two moving averages for the RS Line. Using two moving averages you can quickly identify the direction of the trend and also pinpoint where the faster moving average crosses over or under the slower moving average.
While beta testing this indicator, we performed a study using Bitcoin. In 2021 we’ve seen an increasing correlation of BTC and the S&P 500. This is most likely due to the fact that both crypto and stocks are riskier than other financial assets such as bonds and commodities. When the market is risk-off, both the S&P 500 and Bitcoin tend to sell off together.
For the BTC test case we used two moving averages of the RS Line, 8-EMA and 50-SMA. In the chart that follows you can see a breakdown of how this played out over the last ~2 years. A positive divergence is indicated by the 8-EMA of RS crossing above the 50-SMA, and vice versa for a negative divergence.
Here's another example using TSLA:
Features
■ Configure up to two moving averages for each timeframe.
■ Optional symbols indicate moving average crossovers.
■ Configure custom alerts on crossovers, for any timeframe.
■ Optional moving average cloud makes it easy to identify if slower moving average is above/below faster moving average.
■ Configurable index, defaulting to S&P 500 (SPX).
Acknowledgement
This project is a collaborative effort with blakedavis17 a Crypto-Equity Analyst. Based on a discussion with Blake about a moving average crossover using the RS Line, we created a simple indicator to explore the concept further. We were very encouraged with the results of backtesting and decided to publish the indicator as we believe it may be a helpful tool for both equity and crypto traders.
リリースノート
Version 2.0■ Minor change to Settings dialog.
リリースノート
Version 3.0■ Crossover symbols can now be configured, both style and color.
リリースノート
Version 4.0■ Option to show an RS Line new high indicator, with customizable shape and color.
■ Option to show all-time-high indicator.
リリースノート
Version 5.0■ Update to the all-time-high (ATH) calculation.
保護スクリプト
このスクリプトのソースコードは非公開で投稿されています。 ただし、制限なく自由に使用できます – 詳細はこちらでご確認ください。
Join traders in over 40 countries and LevelUp!
tradingview.com/spaces/LevelUpTools/
tradingview.com/spaces/LevelUpTools/
免責事項
この情報および投稿は、TradingViewが提供または推奨する金融、投資、トレード、その他のアドバイスや推奨を意図するものではなく、それらを構成するものでもありません。詳細は利用規約をご覧ください。
保護スクリプト
このスクリプトのソースコードは非公開で投稿されています。 ただし、制限なく自由に使用できます – 詳細はこちらでご確認ください。
Join traders in over 40 countries and LevelUp!
tradingview.com/spaces/LevelUpTools/
tradingview.com/spaces/LevelUpTools/
免責事項
この情報および投稿は、TradingViewが提供または推奨する金融、投資、トレード、その他のアドバイスや推奨を意図するものではなく、それらを構成するものでもありません。詳細は利用規約をご覧ください。