PROTECTED SOURCE SCRIPT
Cycle SR
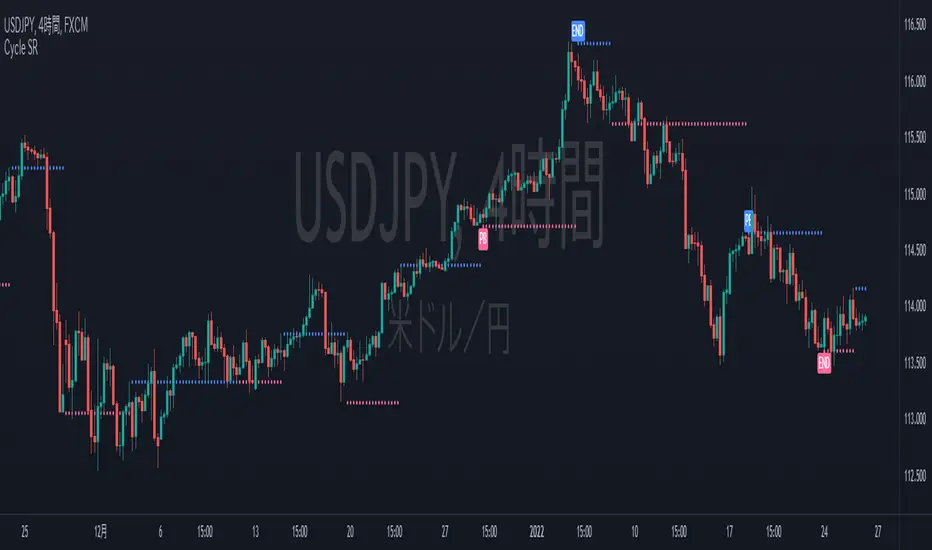
Overview:
This indicator draws resistance and support lines calculated from market cycles.
By default, blue dots indicate resistance and red dots indicate support.
This indicator draws resistance and support lines calculated from market cycles.
By default, blue dots indicate resistance and red dots indicate support.
保護スクリプト
このスクリプトのソースコードは非公開で投稿されています。 ただし、制限なく自由に使用できます – 詳細はこちらでご確認ください。
免責事項
この情報および投稿は、TradingViewが提供または推奨する金融、投資、トレード、その他のアドバイスや推奨を意図するものではなく、それらを構成するものでもありません。詳細は利用規約をご覧ください。
免責事項
この情報および投稿は、TradingViewが提供または推奨する金融、投資、トレード、その他のアドバイスや推奨を意図するものではなく、それらを構成するものでもありません。詳細は利用規約をご覧ください。