OPEN-SOURCE SCRIPT
更新済 Least Squares Bollinger Bands
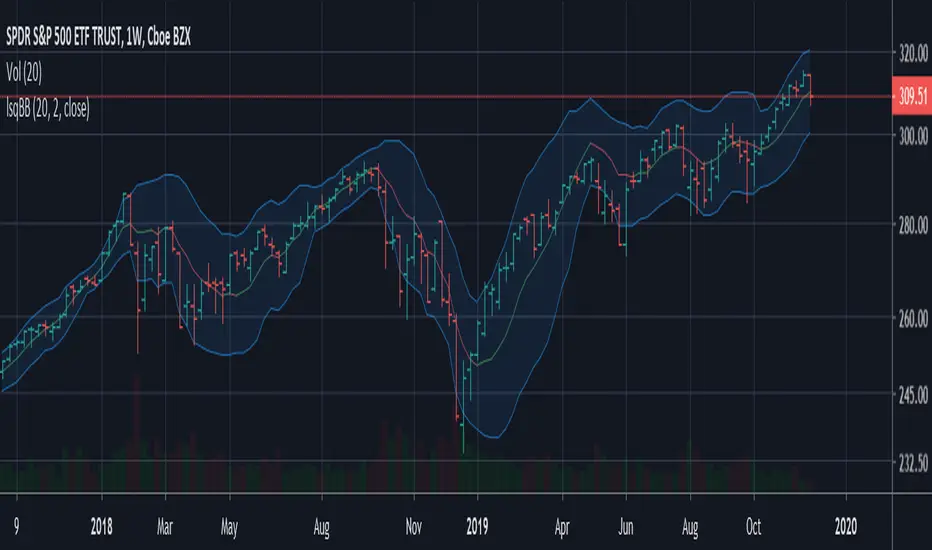
Similar to Bollinger Bands but adjusted for momentum. Instead of having the centerline be a simply moving average and the bands showing the rolling variance, this does a linear regression, and shows the LSMA at the center, while the band width is the average deviation from the regression line instead of from the SMA.
This means that unlike for normal Bollinger bands, momentum does not make the bands wider, and that the bands tend to be much better centered around the price action with band walks being more reliable indicators of undersold/oversold conditions. They also give a much narrower estimate of current volatility/price range.
This means that unlike for normal Bollinger bands, momentum does not make the bands wider, and that the bands tend to be much better centered around the price action with band walks being more reliable indicators of undersold/oversold conditions. They also give a much narrower estimate of current volatility/price range.
リリースノート
Cleaned up some code to make it more general. Now easy to modify with whatever moving average you like if you want to vary the weights on the linear regression. Also added a toggle to disable working with logged values.オープンソーススクリプト
TradingViewの精神に則り、このスクリプトの作者はコードをオープンソースとして公開してくれました。トレーダーが内容を確認・検証できるようにという配慮です。作者に拍手を送りましょう!無料で利用できますが、コードの再公開はハウスルールに従う必要があります。
免責事項
この情報および投稿は、TradingViewが提供または推奨する金融、投資、トレード、その他のアドバイスや推奨を意図するものではなく、それらを構成するものでもありません。詳細は利用規約をご覧ください。
オープンソーススクリプト
TradingViewの精神に則り、このスクリプトの作者はコードをオープンソースとして公開してくれました。トレーダーが内容を確認・検証できるようにという配慮です。作者に拍手を送りましょう!無料で利用できますが、コードの再公開はハウスルールに従う必要があります。
免責事項
この情報および投稿は、TradingViewが提供または推奨する金融、投資、トレード、その他のアドバイスや推奨を意図するものではなく、それらを構成するものでもありません。詳細は利用規約をご覧ください。