PROTECTED SOURCE SCRIPT
Daily RVOL (Cumulative with Multi Alerts)
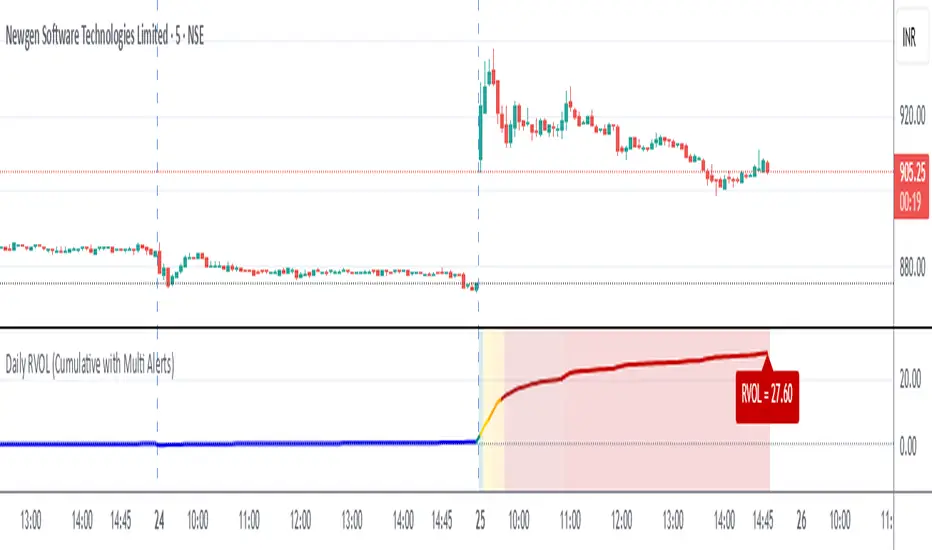
Daily RVOL (Cumulative with Multi Alerts)
This indicator plots Relative Volume (RVOL) on intraday charts by comparing today’s cumulative traded volume with either:
The average daily volume of the past N days (default 5), or
Yesterday’s total daily volume (selectable from settings).
Unlike per-candle RVOL indicators, this version tracks cumulative intraday RVOL that only increases throughout the trading day. This matches how professional scanners (like Chartink/Gocharting) calculate RVOL, e.g. RVOL = 6 at open → 12 → 20 → 45 by end of day.
保護スクリプト
このスクリプトのソースコードは非公開で投稿されています。 ただし、制限なく自由に使用できます – 詳細はこちらでご確認ください。
免責事項
この情報および投稿は、TradingViewが提供または推奨する金融、投資、トレード、その他のアドバイスや推奨を意図するものではなく、それらを構成するものでもありません。詳細は利用規約をご覧ください。
免責事項
この情報および投稿は、TradingViewが提供または推奨する金融、投資、トレード、その他のアドバイスや推奨を意図するものではなく、それらを構成するものでもありません。詳細は利用規約をご覧ください。