PROTECTED SOURCE SCRIPT
M2 + Fed Funds con anotaciones históricas
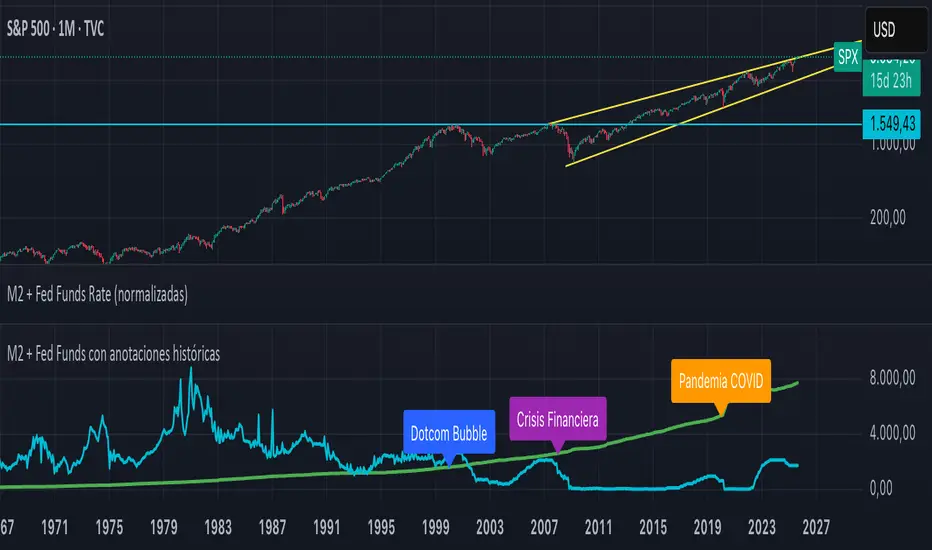
This TradingView indicator creates a separate panel that displays the historical evolution of M2 Money Stock (US) and the Federal Funds Rate, both normalized to a base of 100 for easier comparison. It highlights key historical events with annotations, including:
2000: Dotcom Bubble
2008: Global Financial Crisis
2020: COVID-19 Pandemic
The script allows users to visually analyze the relationship between monetary liquidity (M2) and interest rates, showing how changes in Fed policy correspond to major economic events and trends.
2000: Dotcom Bubble
2008: Global Financial Crisis
2020: COVID-19 Pandemic
The script allows users to visually analyze the relationship between monetary liquidity (M2) and interest rates, showing how changes in Fed policy correspond to major economic events and trends.
保護スクリプト
このスクリプトのソースコードは非公開で投稿されています。 ただし、制限なく自由に使用できます – 詳細はこちらでご確認ください。
免責事項
この情報および投稿は、TradingViewが提供または推奨する金融、投資、トレード、その他のアドバイスや推奨を意図するものではなく、それらを構成するものでもありません。詳細は利用規約をご覧ください。
保護スクリプト
このスクリプトのソースコードは非公開で投稿されています。 ただし、制限なく自由に使用できます – 詳細はこちらでご確認ください。
免責事項
この情報および投稿は、TradingViewが提供または推奨する金融、投資、トレード、その他のアドバイスや推奨を意図するものではなく、それらを構成するものでもありません。詳細は利用規約をご覧ください。