INVITE-ONLY SCRIPT
NKP Strength Meter
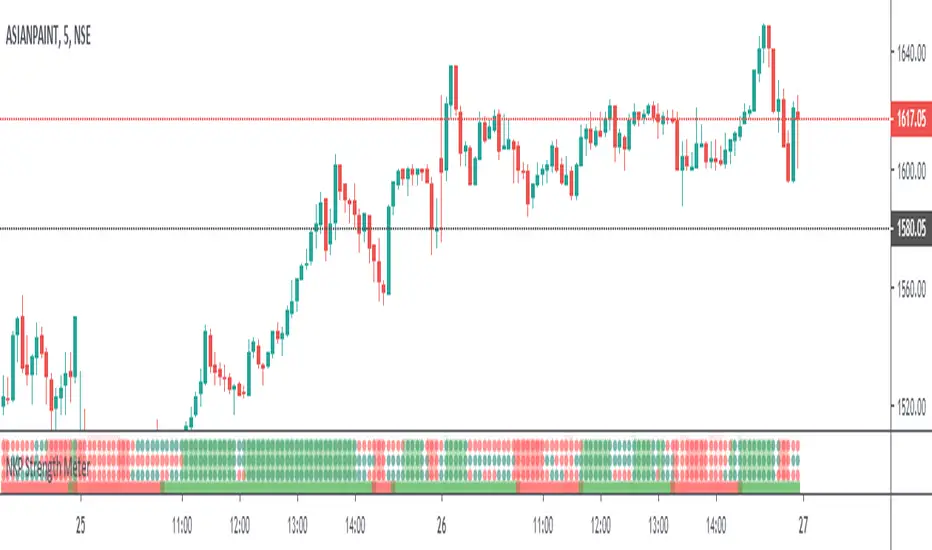
NKP Strength Meter is an indicator it will show the strength of the trend based on built-ins indicators like RSI , MACD , ADX , PSAR and some mathematical formulas. we can apply in any time frame. it is dynamically calculate the values based which time frame user got selected. By using this we can trend strength, read on. ( we can apply this in any time frame chart)
NKP Strength Meter has 3 main components:
one trend bar - it will plot only in two colors either Green or Red. Green indicates buy strength Red indicates sell strength.
three trend dotted lines - these also will plot only in two color either Red or Green. Green indicates buy strength Red indicates sell strength.
color plotted area - if all are in the Green it will plot the green background. all are in red it will plot the red background based these we can easily identify the strength of the trend while seeing the chart.
How does it work?
If all trend bar and dotted lines are green it means buyers strength is more.(continue with uptrend)
If all trend bar and dotted lines are red it means seller strength is more.(continue with downtrend)
mixed colors on dotted line and trend bar there is strength at that time.
What are the signals?
it wont generate any signals. just it will plot the strength dotted lines and trend bar it identify the strength of the trend.
Can we set the Alert on this?
No, it will use to see the strength of the trend while taking the order.(just for trend confirmation)
IMPORTANT: this script does not generate any signals. Perfectly catches long runs in trends at all underlings (stocks, indexes ) at any time frame.
Try it! Good luck and good trading!
For access, please PM us or visit the link below in our Signature.
招待専用スクリプト
このスクリプトは作者が承認したユーザーのみアクセス可能です。使用するにはアクセス申請をして許可を得る必要があります。通常は支払い後に承認されます。詳細は下記の作者の指示に従うか、NKPTechnicalTraderに直接お問い合わせください。
TradingViewは、作者を完全に信頼し、スクリプトの動作を理解していない限り、有料スクリプトの購入・使用を推奨しません。コミュニティスクリプトには無料のオープンソースの代替が多数あります。
作者の指示
免責事項
この情報および投稿は、TradingViewが提供または推奨する金融、投資、トレード、その他のアドバイスや推奨を意図するものではなく、それらを構成するものでもありません。詳細は利用規約をご覧ください。