OPEN-SOURCE SCRIPT
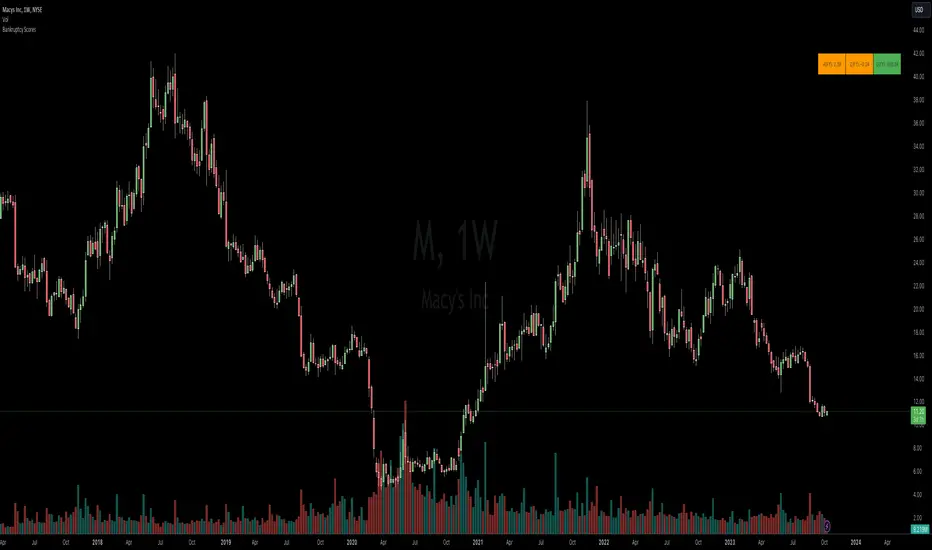
Bankruptcy Risk: Altman Z-Score, Zmijewski Score, Grover G

This custom indicator calculates three common bankruptcy risk scores:
Altman Z-Score
Zmijewski Score
Grover Model: G-Score
The indicator pulls key financial metrics and calculates each score, then displays the results in a table with color-coding based on the level of bankruptcy risk.
Users can toggle between FQ and FY periods and view details on the underlying metrics. This provides an easy way to visualize bankruptcy risk for a company and compare across different scoring models.
Useful for fundamental analysis and assessing financial health.
The financial ratios and methodology are based on research described in
"Analysis of Bankruptcy Prediction Models in Determining Bankruptcy of Consumer Goods Companies in Indonesia" (Thomas et al., 2020).
- Altman Z-Score
- Zmijewski Score
- Grover G-Score
Altman Z-Score
- Companies are in healthy condition if the Z-Score > 2.6.
- Companies are in vulnerable conditions and need improvement (grey area) if the score is between 1.1 - 2.6.
- Companies have the potential to lead to serious bankruptcy if the Z-Score < 1.1.
Zmijewski Score
- The company has the potential to go bankrupt if the value of X Score > 0.
- The company is healthy if the value of X Score < 0.
Grover Model: G-Score
- The company has the potential to go bankrupt if the G Score ≤ -0.02.
- The company is in good health if the value of G Score ≥ 0.001.
The indicator pulls key financial metrics and calculates each score, then displays the results in a table with color-coding based on the level of bankruptcy risk.
Users can toggle between FQ and FY periods and view details on the underlying metrics. This provides an easy way to visualize bankruptcy risk for a company and compare across different scoring models.
Useful for fundamental analysis and assessing financial health.
The financial ratios and methodology are based on research described in
"Analysis of Bankruptcy Prediction Models in Determining Bankruptcy of Consumer Goods Companies in Indonesia" (Thomas et al., 2020).
オープンソーススクリプト
TradingViewの精神に則り、このスクリプトの作者はコードをオープンソースとして公開してくれました。トレーダーが内容を確認・検証できるようにという配慮です。作者に拍手を送りましょう!無料で利用できますが、コードの再公開はハウスルールに従う必要があります。
免責事項
この情報および投稿は、TradingViewが提供または推奨する金融、投資、トレード、その他のアドバイスや推奨を意図するものではなく、それらを構成するものでもありません。詳細は利用規約をご覧ください。
オープンソーススクリプト
TradingViewの精神に則り、このスクリプトの作者はコードをオープンソースとして公開してくれました。トレーダーが内容を確認・検証できるようにという配慮です。作者に拍手を送りましょう!無料で利用できますが、コードの再公開はハウスルールに従う必要があります。
免責事項
この情報および投稿は、TradingViewが提供または推奨する金融、投資、トレード、その他のアドバイスや推奨を意図するものではなく、それらを構成するものでもありません。詳細は利用規約をご覧ください。