OPEN-SOURCE SCRIPT
FREE INDICATOR: VOLUME MOMENTUM
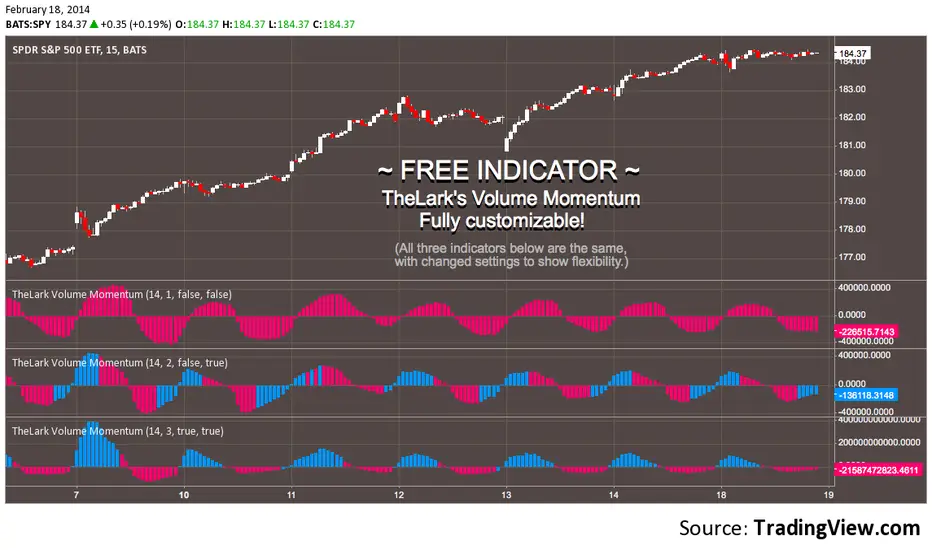
For the momentum trader there are plenty of price momentum indicators, here's one that tracks the volume's momentum. Rising momentum in both price and volume is great for any momentum trader.
Add this to your chart, play with the settings, and maybe you'll notice something new!
Grab the source code here: pastebin.com/DUw3kyMK
Installation video by ChrisMoody here : vimeopro.com/user14689865/tradingviewcom-how-to-videos
·´¯`·.¸¸.·´¯`· Feel free to follow me to keep up with my latest scripts! ·´¯`·.¸¸.·´¯`·
·´¯`·.¸¸.·´¯`· PLEASE THUMB UP OR STAR IF YOU LIKE THIS INDICATOR! ·´¯`·.¸¸.·´¯`·
I'd like as many people as possible to get it :)
オープンソーススクリプト
TradingViewの精神に則り、このスクリプトの作者はコードをオープンソースとして公開してくれました。トレーダーが内容を確認・検証できるようにという配慮です。作者に拍手を送りましょう!無料で利用できますが、コードの再公開はハウスルールに従う必要があります。
免責事項
この情報および投稿は、TradingViewが提供または推奨する金融、投資、トレード、その他のアドバイスや推奨を意図するものではなく、それらを構成するものでもありません。詳細は利用規約をご覧ください。
オープンソーススクリプト
TradingViewの精神に則り、このスクリプトの作者はコードをオープンソースとして公開してくれました。トレーダーが内容を確認・検証できるようにという配慮です。作者に拍手を送りましょう!無料で利用できますが、コードの再公開はハウスルールに従う必要があります。
免責事項
この情報および投稿は、TradingViewが提供または推奨する金融、投資、トレード、その他のアドバイスや推奨を意図するものではなく、それらを構成するものでもありません。詳細は利用規約をご覧ください。