PROTECTED SOURCE SCRIPT
更新済 PVA Volume
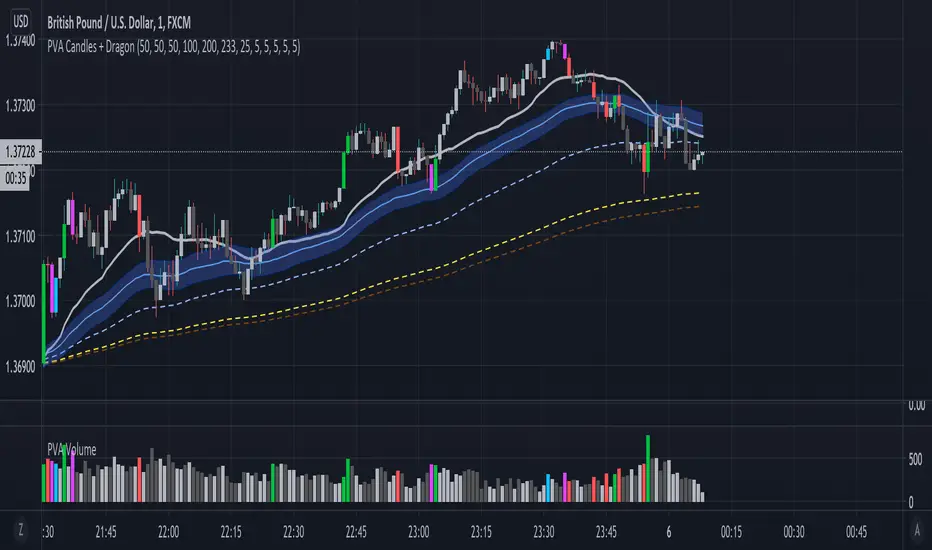
The PVA volume is part of PVSRA and it shows different bar colors according to the conditions below.
Situation "Climax". When volume >= 200% of the average volume of the 10
previous chart candles or where the product of candle spread x candle volume is >= the
highest for the 10 previous chart candles. Default Colors: Bullish bars are green and
Bearish bars are red.
Situation "Volume Rising Above Average". When volume >= 150% of the average
volume of the 10 previous chart candles. Default Colors: Bullish bars are blue and bearish bars are
blue-violet.
リリースノート
I changed the transparency to zero so that the volume bar becomes more visible and so that it resembles the original PVSRA script.保護スクリプト
このスクリプトのソースコードは非公開で投稿されています。 ただし、制限なく自由に使用できます – 詳細はこちらでご確認ください。
免責事項
この情報および投稿は、TradingViewが提供または推奨する金融、投資、トレード、その他のアドバイスや推奨を意図するものではなく、それらを構成するものでもありません。詳細は利用規約をご覧ください。
免責事項
この情報および投稿は、TradingViewが提供または推奨する金融、投資、トレード、その他のアドバイスや推奨を意図するものではなく、それらを構成するものでもありません。詳細は利用規約をご覧ください。