INVITE-ONLY SCRIPT
Axel ATR Flow
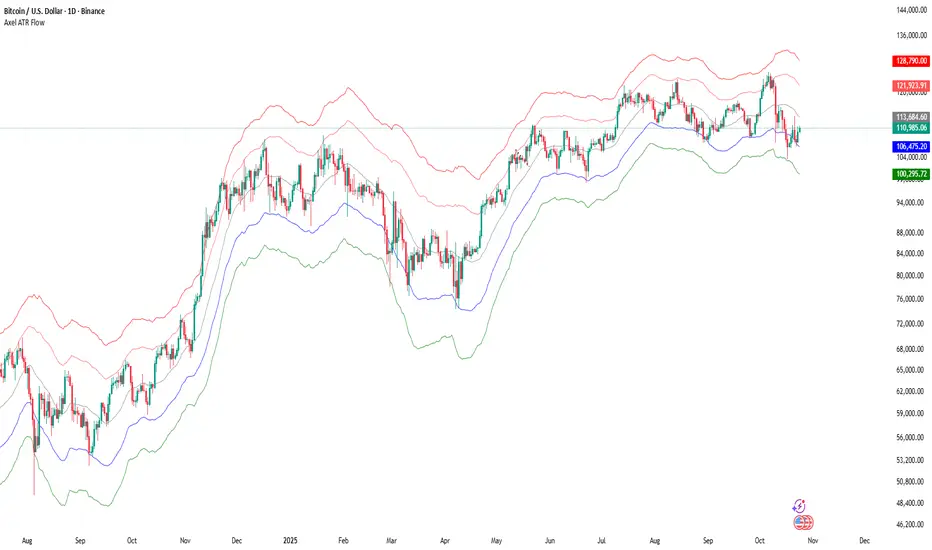
Axel ATR Flow is a dynamic, volatility-adaptive channel designed to visualize the natural rhythm of market movement.
The indicator builds its structure around the Average True Range (ATR) and a smooth central line — called the Flow — which acts as a flexible base.
As volatility increases, the channel expands; when the market calms down, it contracts.
This creates an adaptive envelope that helps traders see where price is likely to find balance, support, or exhaustion.

Unlike traditional static channels, Axel ATR Flow features real-time interpolation between closed and live data within the same higher-timeframe candle.
This means that even intraday, the indicator smoothly follows actual market movement, offering a realistic view of active volatility.
How it works
The system builds five key elements:
Central Flow Line — the main trend reference.
Main Trail — the primary volatility boundary and near-support zone.
Lower Trail — a deeper overshoot zone, often forming major accumulation areas.
An Upper Trail — the first resistance boundary.
An Upper2 Trail — the extreme resistance level, marking potential exhaustion.
The indicator adapts these levels dynamically using ATR calculations and smoothing filters (SMA or ZLEMA).
It can be locked to specific higher timeframes (Daily, Weekly, Monthly, 2D, 3D) while still reacting smoothly to current intraday price movement.
How to use it
• Trend direction:
The slope of the Flow Line represents the active trend.
When it’s rising, market flow is bullish; when falling, bearish pressure dominates.
• Support and resistance:
The Main and Lower Trails act as dynamic supports where price often bounces in an uptrend.
The Upper and Upper2 Trails mark zones where rallies typically slow down or reverse.
• Entries and exits:
— Buy setups often appear when price approaches or slightly dips below the Main or Lower Trail during an uptrend.
— Take-profit zones align with touches of the Upper or Upper2 Trails.
— In sideways markets, repeated touches at both extremes often precede breakout volatility.
• Volatility signals:
A wide channel means strong volatility — wait for stabilization or use smaller position sizes.
A narrow channel shows contraction — conditions are favorable for continuation trades after breakout.
Practical tips
• Combine Axel ATR Flow with oscillators such as RSI or Stoch RSI to confirm overbought or oversold conditions near outer bands.
• On higher timeframes, the indicator reveals the breathing pattern of the market — periods of compression followed by expansion.
• For spot trading or DCA strategies, entries near the Lower Trail during strong trends often provide excellent accumulation opportunities.
• Works effectively across markets: crypto, forex, indices, and commodities.
Summary
Axel ATR Flow unites precise volatility analysis with smooth visual representation of market structure.
It can be used as both a trend filter and an execution framework, identifying where price flow tends to stabilize or exhaust.
Part of the Axel Alts system, this indicator was engineered for traders who value clarity, adaptability, and realism in market analysis.
The indicator builds its structure around the Average True Range (ATR) and a smooth central line — called the Flow — which acts as a flexible base.
As volatility increases, the channel expands; when the market calms down, it contracts.
This creates an adaptive envelope that helps traders see where price is likely to find balance, support, or exhaustion.
Unlike traditional static channels, Axel ATR Flow features real-time interpolation between closed and live data within the same higher-timeframe candle.
This means that even intraday, the indicator smoothly follows actual market movement, offering a realistic view of active volatility.
How it works
The system builds five key elements:
Central Flow Line — the main trend reference.
Main Trail — the primary volatility boundary and near-support zone.
Lower Trail — a deeper overshoot zone, often forming major accumulation areas.
An Upper Trail — the first resistance boundary.
An Upper2 Trail — the extreme resistance level, marking potential exhaustion.
The indicator adapts these levels dynamically using ATR calculations and smoothing filters (SMA or ZLEMA).
It can be locked to specific higher timeframes (Daily, Weekly, Monthly, 2D, 3D) while still reacting smoothly to current intraday price movement.
How to use it
• Trend direction:
The slope of the Flow Line represents the active trend.
When it’s rising, market flow is bullish; when falling, bearish pressure dominates.
• Support and resistance:
The Main and Lower Trails act as dynamic supports where price often bounces in an uptrend.
The Upper and Upper2 Trails mark zones where rallies typically slow down or reverse.
• Entries and exits:
— Buy setups often appear when price approaches or slightly dips below the Main or Lower Trail during an uptrend.
— Take-profit zones align with touches of the Upper or Upper2 Trails.
— In sideways markets, repeated touches at both extremes often precede breakout volatility.
• Volatility signals:
A wide channel means strong volatility — wait for stabilization or use smaller position sizes.
A narrow channel shows contraction — conditions are favorable for continuation trades after breakout.
Practical tips
• Combine Axel ATR Flow with oscillators such as RSI or Stoch RSI to confirm overbought or oversold conditions near outer bands.
• On higher timeframes, the indicator reveals the breathing pattern of the market — periods of compression followed by expansion.
• For spot trading or DCA strategies, entries near the Lower Trail during strong trends often provide excellent accumulation opportunities.
• Works effectively across markets: crypto, forex, indices, and commodities.
Summary
Axel ATR Flow unites precise volatility analysis with smooth visual representation of market structure.
It can be used as both a trend filter and an execution framework, identifying where price flow tends to stabilize or exhaust.
Part of the Axel Alts system, this indicator was engineered for traders who value clarity, adaptability, and realism in market analysis.
招待専用スクリプト
こちらのスクリプトにアクセスできるのは投稿者が承認したユーザーだけです。投稿者にリクエストして使用許可を得る必要があります。通常の場合、支払い後に許可されます。詳細については、以下、作者の指示をお読みになるか、AxelAltsに直接ご連絡ください。
スクリプトの機能を理解し、その作者を全面的に信頼しているのでなければ、お金を支払ってまでそのスクリプトを利用することをTradingViewとしては「非推奨」としています。コミュニティスクリプトの中で、その代わりとなる無料かつオープンソースのスクリプトを見つけられる可能性もあります。
作者の指示
This indicator is an invite-only script.
To request access, click the Contact author button on this page and send a short message introducing yourself.
Requests are reviewed manually, and access is granted only to verified or known users.
免責事項
これらの情報および投稿は、TradingViewが提供または保証する金融、投資、取引、またはその他の種類のアドバイスや推奨を意図したものではなく、またそのようなものでもありません。詳しくは利用規約をご覧ください。