INVITE-ONLY SCRIPT
更新済 Market Volatility Momentum + Trend Filter Pro @MaxMaserati
# 📊 Market Volatility Momentum + Trend Filter Pro
## 🎯 Overview
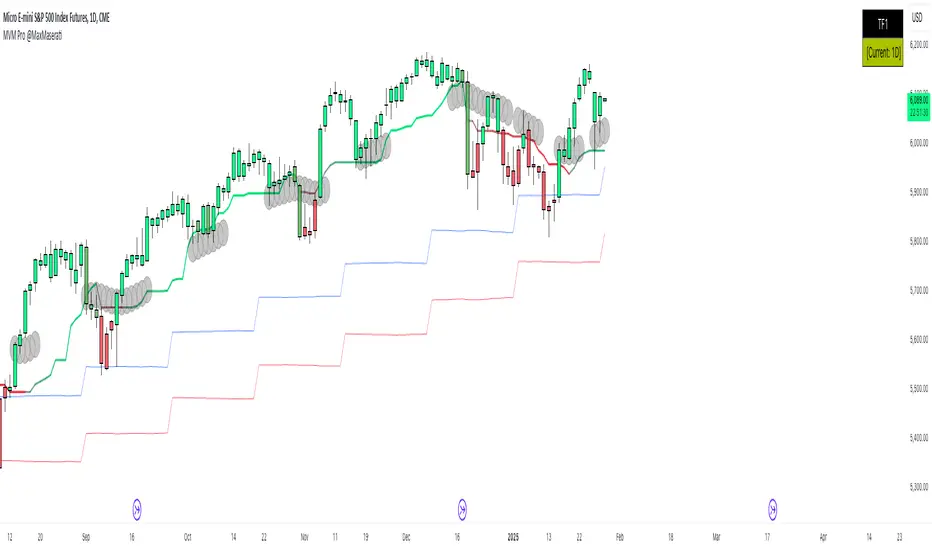
An enhanced version of the Market Momentum Indicator, combining the power of momentum analysis with adaptive volatility bands and trend filtering. This professional tool helps traders identify market direction and potential momentum shifts with greater precision.
## 🔄 Core Momentum Components
### 📈 Momentum Line
- Calculated using the midpoint between highest and lowest prices over 14 periods
- Provides a clear reference for price direction
- Acts as a dynamic support/resistance level
### 📉 Momentum Signal
- Offset from the Momentum Line by 0.25 tick size
- Creates a precise visual guide for momentum shifts
- Standard increment compatible with most markets

## 💫 Enhanced Features
### 🌊 Trend Filter
- Dynamic color-coding system showing trend strength
- Customizable length and damping parameters
- Visual identification of neutral market conditions
### 📊 Volatility Bands
- Adaptive bands that expand and contract with market volatility
- Choice between short-term and long-term trend adaptation
- Provides additional confirmation of trend strength
## 📝 Trading Signals
### 📈 Bullish Momentum
- Both momentum lines below price
- Enhanced by trend filter color confirmation
- Supported by volatility band positioning
### 📉 Bearish Momentum
- Both momentum lines above price
- Confirmed by trend filter color signals
- Reinforced by volatility band context
### ⚖️ Consolidation
- Momentum lines within price range
- Neutral trend indication with deep blue area
- Potential breakout preparation phase
## ⚙️ Multi-Timeframe Analysis
- Dual timeframe capability for comprehensive market view
- Custom timeframe selection with current chart reference
- Real-time timeframe display in top-right corner
## 🎨 Visual Features
- Dynamic bar coloring system reflecting trend strength
- Clear trend visualization through color gradients
- Optional line smoothing for reduced noise
- Customizable color schemes
## 💡 Tips for Usage
1. Monitor the position of price relative to momentum lines
2. Use trend filter colors for confirmation
3. Watch for convergence with volatility bands
4. Pay attention to neutral market signals
5. Utilize multi-timeframe analysis for better context
## ⚠️ Important Notes
- Originally designed without smoothing (smoothing optional)
- Best used with multiple timeframe analysis
- Provides clearest signals in trending markets
- Works effectively across all tradable assets
Note: Past performance doesn't guarantee future results. Always practice proper risk management and develop your trading plan.
## 🎯 Overview
An enhanced version of the Market Momentum Indicator, combining the power of momentum analysis with adaptive volatility bands and trend filtering. This professional tool helps traders identify market direction and potential momentum shifts with greater precision.
## 🔄 Core Momentum Components
### 📈 Momentum Line
- Calculated using the midpoint between highest and lowest prices over 14 periods
- Provides a clear reference for price direction
- Acts as a dynamic support/resistance level
### 📉 Momentum Signal
- Offset from the Momentum Line by 0.25 tick size
- Creates a precise visual guide for momentum shifts
- Standard increment compatible with most markets
## 💫 Enhanced Features
### 🌊 Trend Filter
- Dynamic color-coding system showing trend strength
- Customizable length and damping parameters
- Visual identification of neutral market conditions
### 📊 Volatility Bands
- Adaptive bands that expand and contract with market volatility
- Choice between short-term and long-term trend adaptation
- Provides additional confirmation of trend strength
## 📝 Trading Signals
### 📈 Bullish Momentum
- Both momentum lines below price
- Enhanced by trend filter color confirmation
- Supported by volatility band positioning
### 📉 Bearish Momentum
- Both momentum lines above price
- Confirmed by trend filter color signals
- Reinforced by volatility band context
### ⚖️ Consolidation
- Momentum lines within price range
- Neutral trend indication with deep blue area
- Potential breakout preparation phase
## ⚙️ Multi-Timeframe Analysis
- Dual timeframe capability for comprehensive market view
- Custom timeframe selection with current chart reference
- Real-time timeframe display in top-right corner
## 🎨 Visual Features
- Dynamic bar coloring system reflecting trend strength
- Clear trend visualization through color gradients
- Optional line smoothing for reduced noise
- Customizable color schemes
## 💡 Tips for Usage
1. Monitor the position of price relative to momentum lines
2. Use trend filter colors for confirmation
3. Watch for convergence with volatility bands
4. Pay attention to neutral market signals
5. Utilize multi-timeframe analysis for better context
## ⚠️ Important Notes
- Originally designed without smoothing (smoothing optional)
- Best used with multiple timeframe analysis
- Provides clearest signals in trending markets
- Works effectively across all tradable assets
Note: Past performance doesn't guarantee future results. Always practice proper risk management and develop your trading plan.
リリースノート
- Bugs fix招待専用スクリプト
このスクリプトは作者が承認したユーザーのみアクセス可能です。使用するにはアクセス申請をして許可を得る必要があります。通常は支払い後に承認されます。詳細は下記の作者の指示に従うか、MaxMaseratiに直接お問い合わせください。
TradingViewは、作者を完全に信頼し、スクリプトの動作を理解していない限り、有料スクリプトの購入・使用を推奨しません。コミュニティスクリプトには無料のオープンソースの代替が多数あります。
作者の指示
Access: https://whop.com/max-maserati/
MMM : No body close (PO4), No Trade.
免責事項
この情報および投稿は、TradingViewが提供または推奨する金融、投資、トレード、その他のアドバイスや推奨を意図するものではなく、それらを構成するものでもありません。詳細は利用規約をご覧ください。
招待専用スクリプト
このスクリプトは作者が承認したユーザーのみアクセス可能です。使用するにはアクセス申請をして許可を得る必要があります。通常は支払い後に承認されます。詳細は下記の作者の指示に従うか、MaxMaseratiに直接お問い合わせください。
TradingViewは、作者を完全に信頼し、スクリプトの動作を理解していない限り、有料スクリプトの購入・使用を推奨しません。コミュニティスクリプトには無料のオープンソースの代替が多数あります。
作者の指示
Access: https://whop.com/max-maserati/
MMM : No body close (PO4), No Trade.
免責事項
この情報および投稿は、TradingViewが提供または推奨する金融、投資、トレード、その他のアドバイスや推奨を意図するものではなく、それらを構成するものでもありません。詳細は利用規約をご覧ください。