PROTECTED SOURCE SCRIPT
SQUEEZE MOMENTUM PRO - JBM
Credits
I am not the author of the original script from which this indicator was based, the script was based on the Squeeze Momentum Indicator by the author LazzyBear
Description
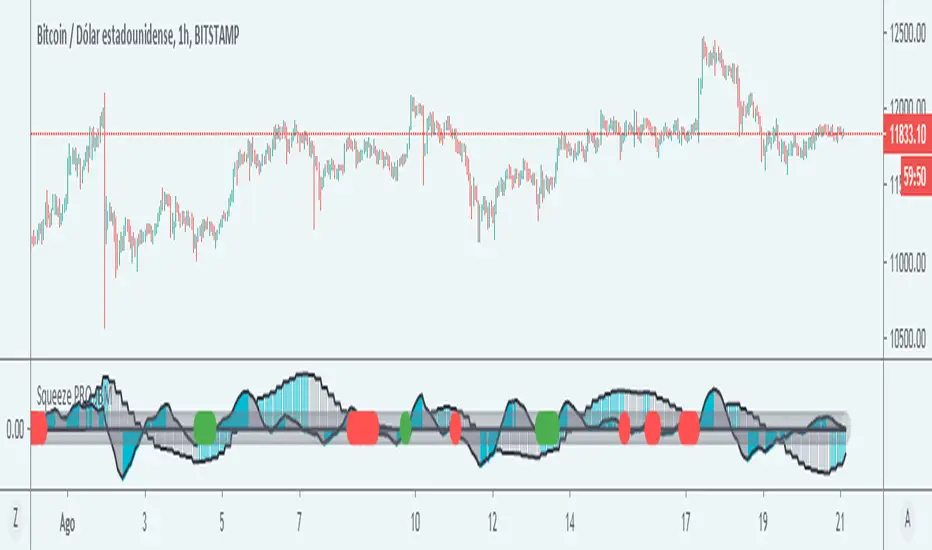
The squeeze momentum PRO is a modification of an existing script that allows you to see the market movements in the form of waves, this indicator allows you to use two squeezes in a chart, the first corresponding to the current timeframe and the second to a greater timeframe. In this way it allows to operate in the direction of the greater temporality but with the impulse of the current movement of the graph.
Its main characteristic is that it provides a signal to the trader in the form of a symbol on the starter, when the indicator shows a green alert it means that both indicators are in a bullish direction so there is a probability that the price will rise, while a red symbol indicates that both temporalities show a bearish direction, so a bearish movement is more likely
The greater temporality is calculated by multiplying the current temporality, for example 1 hour, multiplied by 4, then the greater squeeze temporality will give the momentum of the 4-hour temporality, that the greater momentum will always be four times greater than the current temporality, although this can be changed in the settings.
The signals are not completely reliable so it must be used in conjunction with other indicators or analysis that allows the trader to filter the signals in a better way.
I am not the author of the original script from which this indicator was based, the script was based on the Squeeze Momentum Indicator by the author LazzyBear
Description
The squeeze momentum PRO is a modification of an existing script that allows you to see the market movements in the form of waves, this indicator allows you to use two squeezes in a chart, the first corresponding to the current timeframe and the second to a greater timeframe. In this way it allows to operate in the direction of the greater temporality but with the impulse of the current movement of the graph.
Its main characteristic is that it provides a signal to the trader in the form of a symbol on the starter, when the indicator shows a green alert it means that both indicators are in a bullish direction so there is a probability that the price will rise, while a red symbol indicates that both temporalities show a bearish direction, so a bearish movement is more likely
The greater temporality is calculated by multiplying the current temporality, for example 1 hour, multiplied by 4, then the greater squeeze temporality will give the momentum of the 4-hour temporality, that the greater momentum will always be four times greater than the current temporality, although this can be changed in the settings.
The signals are not completely reliable so it must be used in conjunction with other indicators or analysis that allows the trader to filter the signals in a better way.
保護スクリプト
このスクリプトのソースコードは非公開で投稿されています。 ただし、制限なく自由に使用できます – 詳細はこちらでご確認ください。
免責事項
この情報および投稿は、TradingViewが提供または推奨する金融、投資、トレード、その他のアドバイスや推奨を意図するものではなく、それらを構成するものでもありません。詳細は利用規約をご覧ください。
保護スクリプト
このスクリプトのソースコードは非公開で投稿されています。 ただし、制限なく自由に使用できます – 詳細はこちらでご確認ください。
免責事項
この情報および投稿は、TradingViewが提供または推奨する金融、投資、トレード、その他のアドバイスや推奨を意図するものではなく、それらを構成するものでもありません。詳細は利用規約をご覧ください。