INVITE-ONLY SCRIPT
Price Action based indicator to visualize waves and trends
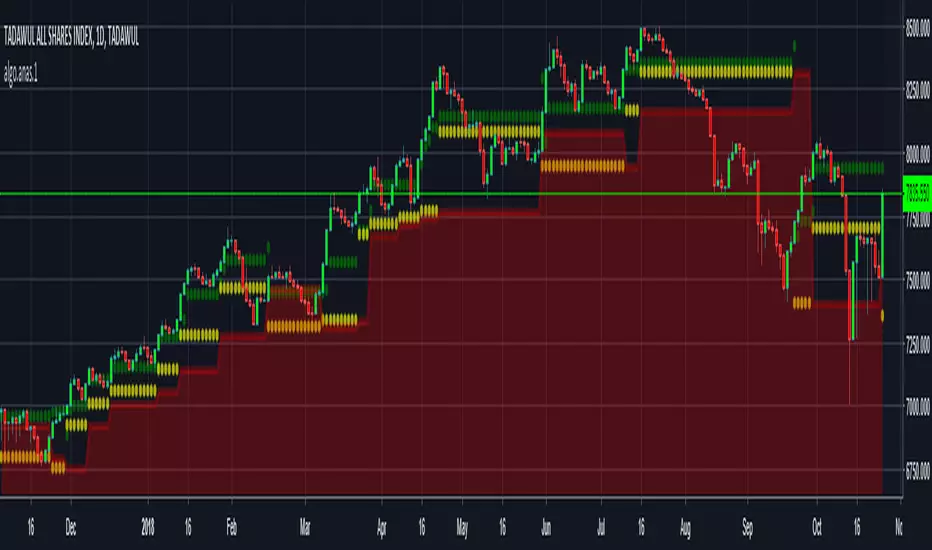
ANAS indicator is a proprietary script that quickly analyze price action and plot 3 price levels around each bar. Namely, green level, yellow level, and red zone. You will easily be able to identify current trend, support/resistance levels, wave count, targets and stops by studying different patterns and scenarios evolving around each bar. When applying the indicator to the same symbol on two different time frames, you differently got an edge!
Nothing can explain things more than giving it a try.
Nothing can explain things more than giving it a try.
招待専用スクリプト
このスクリプトは作者が承認したユーザーのみアクセス可能です。使用するにはアクセス申請をして許可を得る必要があります。通常は支払い後に承認されます。詳細は下記の作者の指示に従うか、anas_algoに直接お問い合わせください。
TradingViewは、作者を完全に信頼し、スクリプトの動作を理解していない限り、有料スクリプトの購入・使用を推奨しません。コミュニティスクリプトには無料のオープンソースの代替が多数あります。
作者の指示
免責事項
この情報および投稿は、TradingViewが提供または推奨する金融、投資、トレード、その他のアドバイスや推奨を意図するものではなく、それらを構成するものでもありません。詳細は利用規約をご覧ください。