PROTECTED SOURCE SCRIPT
更新済 Welivvinnlife & ocsabi03 OBV and GNL Hybrid Oscillator
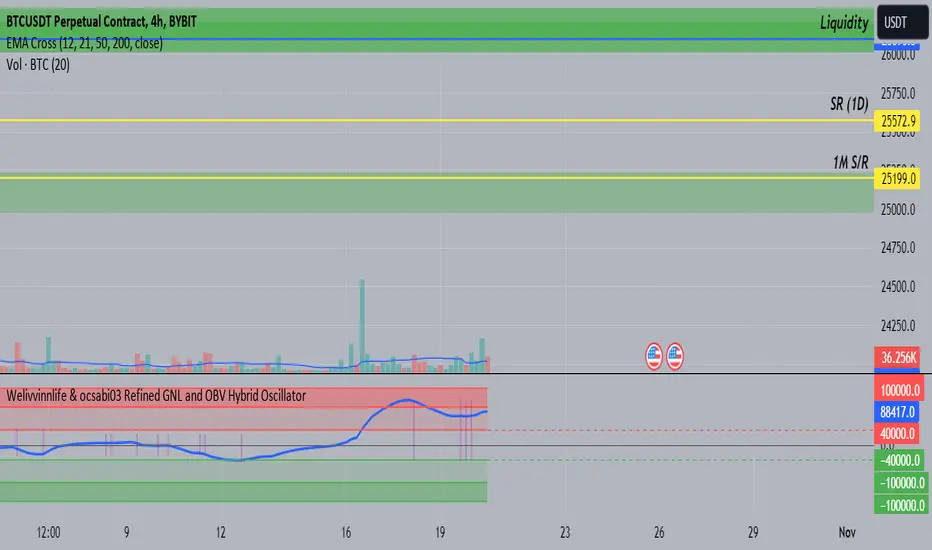
Signal Line (Blue): It gives a smoothed representation of the difference between OBV and GNL. When it moves upwards, it indicates that the recent differences between OBV and GNL are increasing, implying increased bullish momentum. When it moves downwards, it means that the differences are decreasing, suggesting increased bearish momentum.
The purple vertical lines are showing the inflection points of the blue line (if you want to see back in time use replay mode)
the green and red boxes ARE JUST VISUAL AIDS nothing else, not magic, those are the areas where a reversal can happen (not 100% of the time)
THIS IS NOT A MAGIC INDICATOR, ALWAYS USE THIS IN SOME KIND OF SYSTEM
リリースノート
-保護スクリプト
このスクリプトのソースコードは非公開で投稿されています。 しかし、無料かつ制限なしでご利用いただけます ― 詳細についてはこちらをご覧ください。
免責事項
これらの情報および投稿は、TradingViewが提供または保証する金融、投資、取引、またはその他の種類のアドバイスや推奨を意図したものではなく、またそのようなものでもありません。詳しくは利用規約をご覧ください。
免責事項
これらの情報および投稿は、TradingViewが提供または保証する金融、投資、取引、またはその他の種類のアドバイスや推奨を意図したものではなく、またそのようなものでもありません。詳しくは利用規約をご覧ください。