PROTECTED SOURCE SCRIPT
🔵Blue Mark
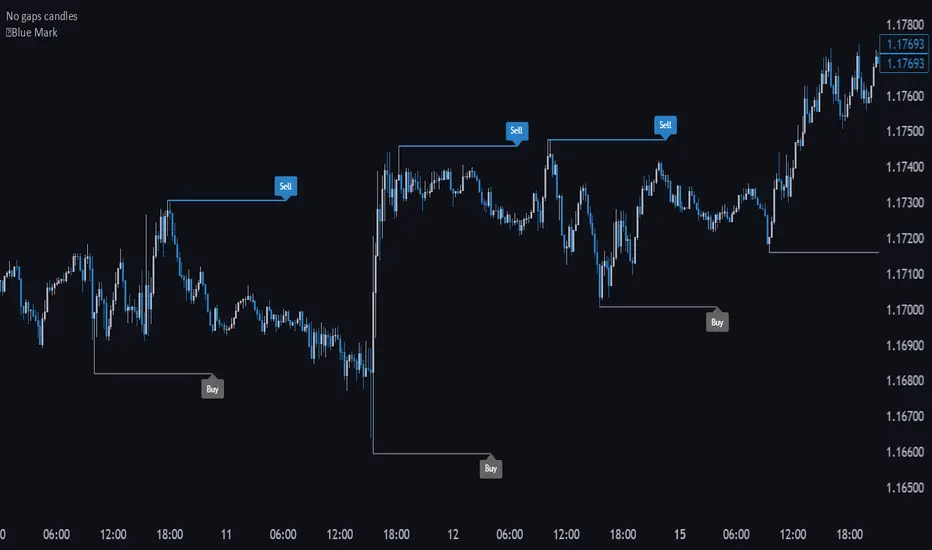
📌 Blue Mark – TradingView Indicator
The Blue Mark indicator highlights extreme price points across multiple timeframes (15m, 5m, 1m), helping intraday traders identify liquidity zones and areas of institutional interest. It is designed for traders who want to spot high-probability entry and exit points based on market structure and volume concentration.
✔️ Marks extreme highs and lows on 15m, 5m, and 1m charts
✔️ Ideal for intraday trading and short-term strategies
✔️ Helps detect liquidity zones where institutional orders are likely concentrated
✔️ Supports tactical entries and exits aligned with market structure
How to use:
Apply the indicator to your chart.
Observe the marked extreme points on different timeframes.
Use these levels to plan entries, exits, or confirm areas of institutional interest.
保護スクリプト
このスクリプトのソースコードは非公開で投稿されています。 ただし、制限なく自由に使用できます – 詳細はこちらでご確認ください。
免責事項
この情報および投稿は、TradingViewが提供または推奨する金融、投資、トレード、その他のアドバイスや推奨を意図するものではなく、それらを構成するものでもありません。詳細は利用規約をご覧ください。
保護スクリプト
このスクリプトのソースコードは非公開で投稿されています。 ただし、制限なく自由に使用できます – 詳細はこちらでご確認ください。
免責事項
この情報および投稿は、TradingViewが提供または推奨する金融、投資、トレード、その他のアドバイスや推奨を意図するものではなく、それらを構成するものでもありません。詳細は利用規約をご覧ください。