Black Flamingo Overlay
The Black Flamingo Overlay part aims to guide the price prediction, by informing on potential short-term reversal zones, and providing take profit lines of counter-trade.
The Black Flamingo Trend part aims to predict changes in current trend, and generate trade entry points.
The Black Flamingo Context aims to inform on trend status on higher timeframes, and is used to confirm signals made by the two others indicators
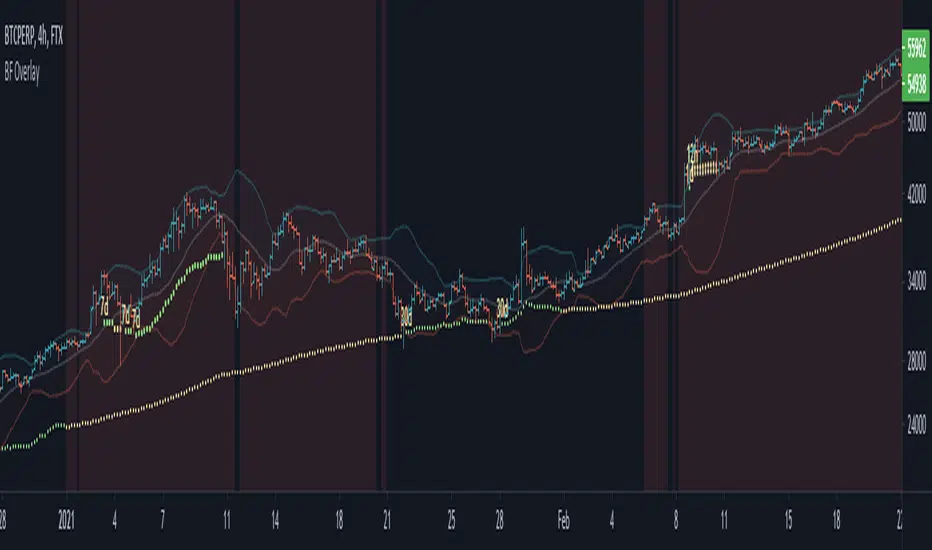
The Black Flamingo Overlay display on the chart the following components :
- A standard Bollinger bands
- A set of multi-timeframe 3D Breakers
3D Breaker is a new tool that aims to provide price target for counter-trend trades.
When a sharp move of price is done on some timeframes (1m, 5m, 15m, 1h, 4h and/or 1d), the indicator will likely start printing a 3D breaker line displayed at every lower timeframe chart.
This line is set at a target price that will very likely be touched in a short-term reversal of the trend.
Note that 3D Breakers are not a mean to predict the end of a trend, they just alert on short-time counter-trade possibility, with defined take profit price. They does not consist of entry point of a trade, but they inform that the price will likely return at this line (which can be used to predict when to close a trade).
When multiple 3D Breaker line in multiple timeframe are printed, it means that the chances of short-term reversal is greater.
There is three parameters to configure the Black Flamingo Overlay :
- Bollinger period : That's simply the period of the displayed bollinger bands
- 3D Breaker Greediness : It is a percentage of the risk the price line is computed. A high greediness will print farther price lines, that will less likely be touched. A low greedyness will print closer price lines that will have a high chances of being touched, but with a diminished expected profit.
- 3D Breaker Convergence Rate : It is a rate of convergence of the 3D Breaker Line to the close price in the time. Increase the convergence rate will make the 3D breaker Line hit by the price sooner, but with diminished expected profit. Lower the convergence rate will make the 3D breaker more horizontal, but will diminished the chance that the line will be touched soon.
This indicators is only accessible on invitation. Please contact me in PM or thisma (https://fr.tradingview.com/u/THISMA/) in order to request us an access.
- Small fixes
- Synchronise the 3D breaker on each displayed timeframe (to display the same breaker line across all TF)
- Add 7D and 30D breakers
- Better synchronisation of the breakers across the timeframes
- Add alerts for start of breaker and breaker line
- Instead of remove the breaker when the number of limit candles is reached, plot with a red color
- Add aggregated alerts on Breakers
- Add a green color when a breaker appear at the middle of a candle (a not confirmed breaker)
- Better placement of the timeframe labels
- Add color configurations
- Fix some bugs related to multi timeframe sync of breakers
- Some bugfixes
- Fix display issues
- Now display 4 breakers instead of 3
- Add an option to configure the sensibility relative to the volatility to trigger the apparition of a Breaker
- Many bugfixes
- Improve the highlight computation
- Allow to disable some breakers
- Synchronize the 7D and 30D breakers with the start of the week and month
- Improve the convergence rate of some breakers to have a better accuracy
- Nearly touched breakers (depends on volatility) are stopped like they was touched
- Add an alert for confirmation of breakers
- Improve the convergence rate of some breakers
- Improve the touched sensibility to volatility computation
- Improve the convergence and touch sensitivity of the breakers
- Better naming of the plots
- Change the symbol of the Breakers to differentiate them more easily
- Version number 1.10
招待専用スクリプト
Only users approved by the author can access this script. You'll need to request and get permission to use it. This is typically granted after payment. For more details, follow the author's instructions below or contact Rix_de_Turcan directly.
TradingView does NOT recommend paying for or using a script unless you fully trust its author and understand how it works. You may also find free, open-source alternatives in our community scripts.
作者の指示
免責事項
招待専用スクリプト
Only users approved by the author can access this script. You'll need to request and get permission to use it. This is typically granted after payment. For more details, follow the author's instructions below or contact Rix_de_Turcan directly.
TradingView does NOT recommend paying for or using a script unless you fully trust its author and understand how it works. You may also find free, open-source alternatives in our community scripts.