PROTECTED SOURCE SCRIPT
Pure Liquidity System (PLS) Robert-PR
Pure Liquidity System (PLS) Robert-PR
The PLS indicator is a comprehensive, advanced tool for tracking institutional liquidity across financial markets. It features:
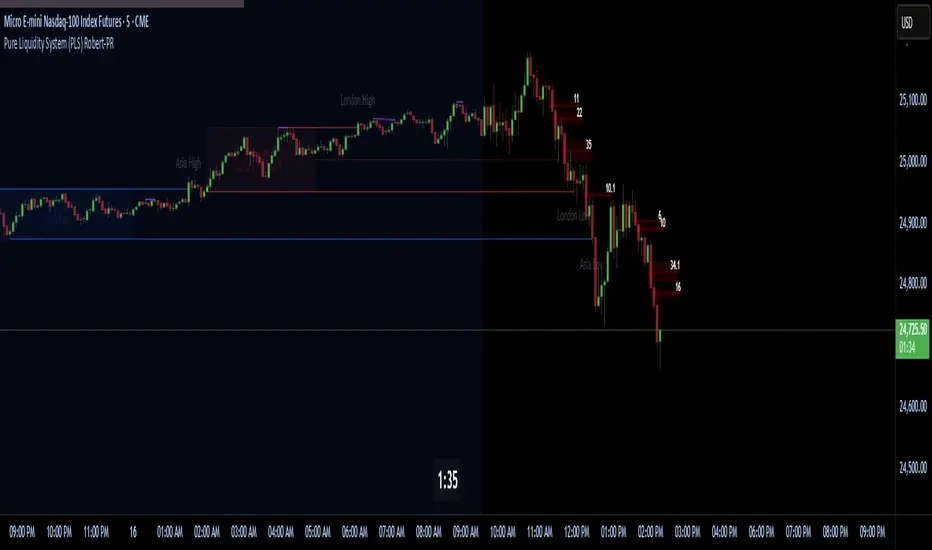
Custom Day Ranges (6pm-6pm): Visualize daily ranges, midlines, and previous high/low levels with customizable tags and horizontal rays, helping you identify key price zones efficiently.
ICT Killzones: Automatically plots Asia, London, and New York (AM, Lunch, PM) sessions, highlighting peak volatility hours. Session pivots, labels, and middle lines offer fast context for intraday strategies.
Equal Highs/Lows Detection: Instantly marks significant equal highs and lows (double tops/bottoms) on any timeframe, making it easy to track liquidity pools and potential reversal points.
Fair Value Gaps (FVGs): Accurately detects and labels bullish/bearish fair value gaps, including gap size, mitigation status, and an optional consequent encroachment line for further analysis.
New York Session Markers: Quickly adds vertical lines for two critical NY session times (9:30 and 11:00 ET), perfect for time-based setups and correlation analysis.
Interactive Checklist & Timer: An intuitive panel for creating and marking off trading routines, complemented by a candle-close countdown timer to keep you focused and disciplined.
All core features are fully adjustable via the quick-access panel—enable or disable boxes, lines, labels, and levels with one click to match your workflow and visual preferences.
Perfect for traders who want to:
Trade alongside institutional “smart money” by focusing on liquidity zones, ICT concepts, and supply & demand mechanics.
Automatically streamline chart analysis while maintaining maximum flexibility, precision, and control over their trading environment.
The PLS indicator is a comprehensive, advanced tool for tracking institutional liquidity across financial markets. It features:
Custom Day Ranges (6pm-6pm): Visualize daily ranges, midlines, and previous high/low levels with customizable tags and horizontal rays, helping you identify key price zones efficiently.
ICT Killzones: Automatically plots Asia, London, and New York (AM, Lunch, PM) sessions, highlighting peak volatility hours. Session pivots, labels, and middle lines offer fast context for intraday strategies.
Equal Highs/Lows Detection: Instantly marks significant equal highs and lows (double tops/bottoms) on any timeframe, making it easy to track liquidity pools and potential reversal points.
Fair Value Gaps (FVGs): Accurately detects and labels bullish/bearish fair value gaps, including gap size, mitigation status, and an optional consequent encroachment line for further analysis.
New York Session Markers: Quickly adds vertical lines for two critical NY session times (9:30 and 11:00 ET), perfect for time-based setups and correlation analysis.
Interactive Checklist & Timer: An intuitive panel for creating and marking off trading routines, complemented by a candle-close countdown timer to keep you focused and disciplined.
All core features are fully adjustable via the quick-access panel—enable or disable boxes, lines, labels, and levels with one click to match your workflow and visual preferences.
Perfect for traders who want to:
Trade alongside institutional “smart money” by focusing on liquidity zones, ICT concepts, and supply & demand mechanics.
Automatically streamline chart analysis while maintaining maximum flexibility, precision, and control over their trading environment.
保護スクリプト
このスクリプトのソースコードは非公開で投稿されています。 ただし、制限なく自由に使用できます – 詳細はこちらでご確認ください。
免責事項
この情報および投稿は、TradingViewが提供または推奨する金融、投資、トレード、その他のアドバイスや推奨を意図するものではなく、それらを構成するものでもありません。詳細は利用規約をご覧ください。
免責事項
この情報および投稿は、TradingViewが提供または推奨する金融、投資、トレード、その他のアドバイスや推奨を意図するものではなく、それらを構成するものでもありません。詳細は利用規約をご覧ください。