PROTECTED SOURCE SCRIPT
Overnight Gap Detector
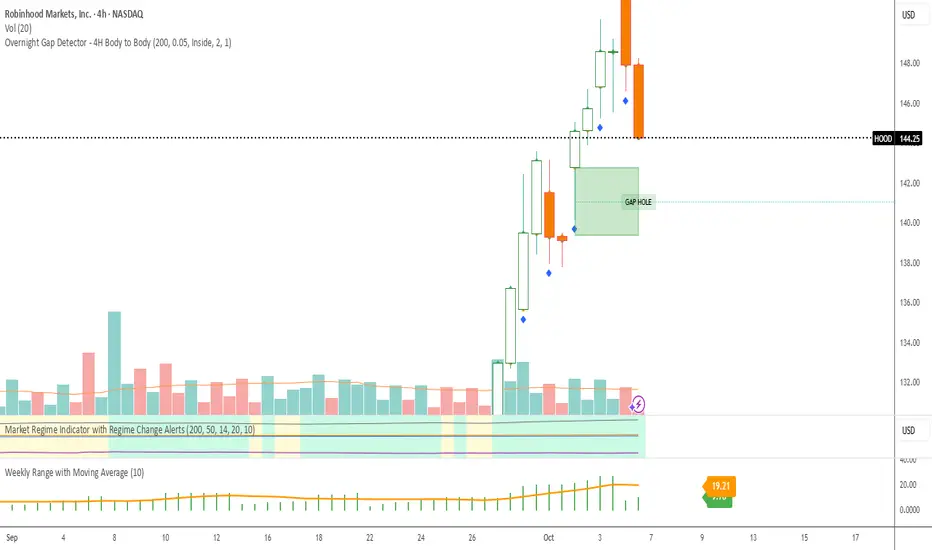
Overnight Gap Detector - 4H Body to Body
What it detects:
The indicator finds overnight gaps - i.e., gaps between trading days based on 4-hour (4H) candle data.
Gap Definition (Wick to Wick):
Gap UP: When yesterday's 4H candle's highest point (high) is BELOW today's 4H candle's lowest point (low) - there's "air" between them
Gap DOWN: When yesterday's 4H candle's lowest point (low) is ABOVE today's 4H candle's highest point (high)
Rectangle Drawing (Body to Body):
Although the gap is detected via wicks, the rectangle is only drawn between the bodies:
Gap UP: Draws from today's open to yesterday's body top (max of open/close)
Gap DOWN: Draws from yesterday's body bottom (min of open/close) to today's open
This means the rectangle does NOT cover the wicks, only the actual gap between bodies.
Midline:
50% line between top and bottom of the gap rectangle
Continues to the right along with the rectangle
Stops when the gap is filled
Gap Filled:
A gap is marked as "filled" when:
Gap UP: Price's close goes DOWN and reaches yesterday's body top
Gap DOWN: Price's close goes UP and reaches yesterday's body bottom
Important: Only close body counts, not wicks!
Visual Elements:
Green box: Gap Up (upward gap)
Red box: Gap Down (downward gap)
Yellow box: Filled gap
Labels: "GAP HOLE" when active, "FILLED gap" when filled
Midline: Dotted line through the middle of the gap
Features:
✅ Works on all timeframes (5min, 15min, 1H, 2H, 4H, etc.) - always uses 4H data
✅ Rectangles expand bar by bar until filled
✅ Customizable colors for gaps, borders, midlines, and labels
✅ Label position (inside or outside box)
✅ Toggle to show/hide labels and midlines
✅ Minimum gap size filter (%)
保護スクリプト
このスクリプトのソースコードは非公開で投稿されています。 ただし、制限なく自由に使用できます – 詳細はこちらでご確認ください。
免責事項
この情報および投稿は、TradingViewが提供または推奨する金融、投資、トレード、その他のアドバイスや推奨を意図するものではなく、それらを構成するものでもありません。詳細は利用規約をご覧ください。
免責事項
この情報および投稿は、TradingViewが提供または推奨する金融、投資、トレード、その他のアドバイスや推奨を意図するものではなく、それらを構成するものでもありません。詳細は利用規約をご覧ください。