OPEN-SOURCE SCRIPT
Simple Moving Average Crossover
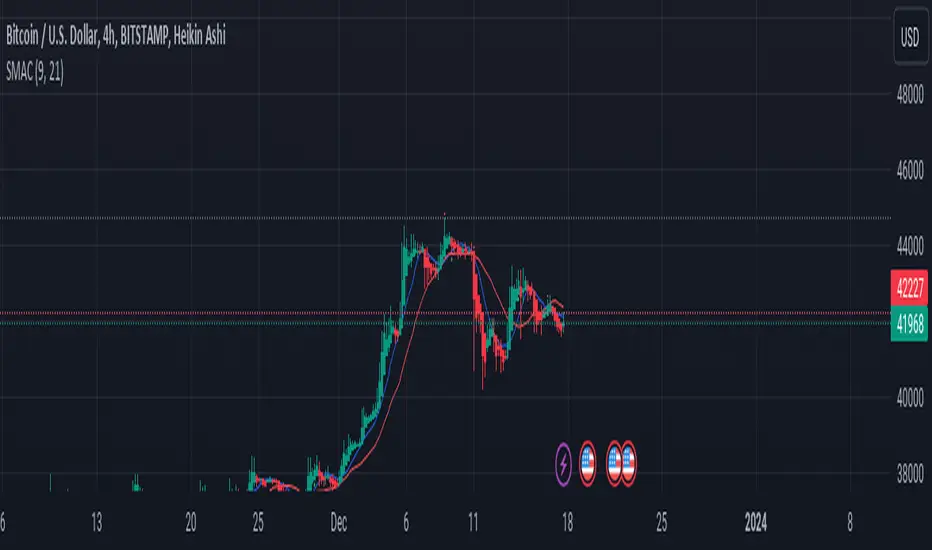
This Pine Script is a TradingView script for creating a technical analysis indicator known as a Simple Moving Average Crossover (SMAC). The script visualizes two moving averages on a chart and provides buy and sell signals based on the crossover of these moving averages.
Here's a breakdown of the script:
Input Parameters:
fastLength: The length of the fast/simple moving average.
slowLength: The length of the slow/simple moving average.
Moving Averages Calculation:
fastMA: Calculates the simple moving average with a length of fastLength using the closing prices.
slowMA: Calculates the simple moving average with a length of slowLength using the closing prices.
Plotting:
Plots the fast and slow moving averages on the chart using different colors.
Buy and Sell Signals:
buySignal: Generates a boolean series indicating a buy signal when the fast moving average crosses above the slow moving average.
sellSignal: Generates a boolean series indicating a sell signal when the fast moving average crosses below the slow moving average.
Plotting Signals:
Plots green triangle-up shapes below price bars for buy signals.
Plots red triangle-down shapes above price bars for sell signals.
In summary, this script helps traders visualize potential trend reversals by identifying points where a shorter-term moving average crosses above (buy signal) or below (sell signal) a longer-term moving average. These crossover signals are often used in trend-following strategies to capture potential changes in market direction. Traders can customize the script by adjusting the input parameters to suit their trading preferences.
オープンソーススクリプト
TradingViewの精神に則り、このスクリプトの作者はコードをオープンソースとして公開してくれました。トレーダーが内容を確認・検証できるようにという配慮です。作者に拍手を送りましょう!無料で利用できますが、コードの再公開はハウスルールに従う必要があります。
免責事項
この情報および投稿は、TradingViewが提供または推奨する金融、投資、トレード、その他のアドバイスや推奨を意図するものではなく、それらを構成するものでもありません。詳細は利用規約をご覧ください。
オープンソーススクリプト
TradingViewの精神に則り、このスクリプトの作者はコードをオープンソースとして公開してくれました。トレーダーが内容を確認・検証できるようにという配慮です。作者に拍手を送りましょう!無料で利用できますが、コードの再公開はハウスルールに従う必要があります。
免責事項
この情報および投稿は、TradingViewが提供または推奨する金融、投資、トレード、その他のアドバイスや推奨を意図するものではなく、それらを構成するものでもありません。詳細は利用規約をご覧ください。