PROTECTED SOURCE SCRIPT
更新済 Index Lead Lag
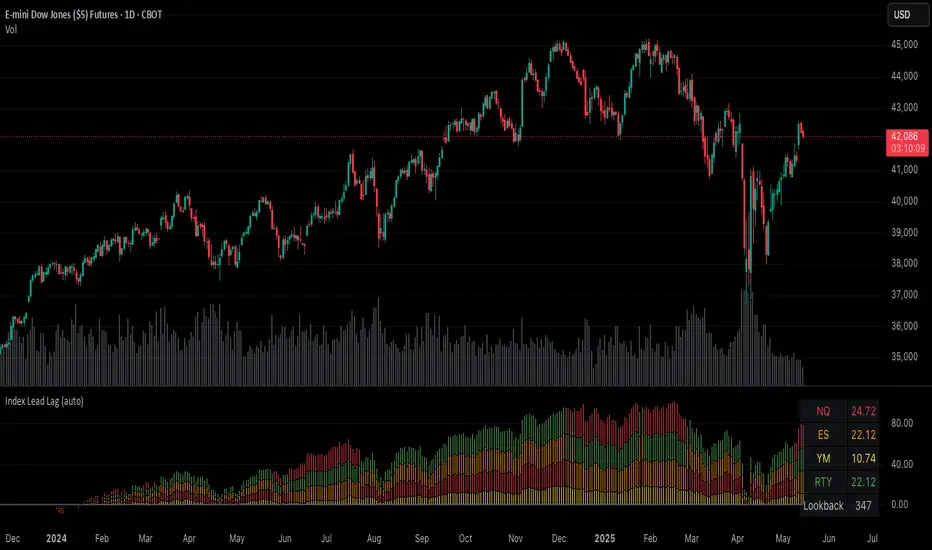
Plots the percent change of each index over a given input lookback window length.
Indices are color coded (and customizable) to identify their respective percent change in the stacked column plot.
Table at the bottom right shows the previously closed bar's percent changes.
Indicator indicates which indices are leading and lagging over the given lookback period.
Indices are color coded (and customizable) to identify their respective percent change in the stacked column plot.
Table at the bottom right shows the previously closed bar's percent changes.
Indicator indicates which indices are leading and lagging over the given lookback period.
リリースノート
Add index changes to status line visualizationリリースノート
Updated default lookback length for improved visibility of trendリリースノート
Added an optional highlight on the reference bar anchor for the current bar's percent change calculation. Highlighted bar appears `lookback window bars input` to the left of the current bar.リリースノート
Adds a vertical bar selector for the comparison start point. Click on the indicator then move the vertical bar to the desired chart data.リリースノート
Allow setting comparison anchor point between:* Time based using vertical selector bar (or timestamp input option)
* Fixed number of bars
リリースノート
bug fix with disabling the table viewリリースノート
try that againリリースノート
v1.1Added a zero reference line on the plot to distinguish positive and negative changes.
保護スクリプト
このスクリプトのソースコードは非公開で投稿されています。 ただし、制限なく自由に使用できます – 詳細はこちらでご確認ください。
免責事項
この情報および投稿は、TradingViewが提供または推奨する金融、投資、トレード、その他のアドバイスや推奨を意図するものではなく、それらを構成するものでもありません。詳細は利用規約をご覧ください。
保護スクリプト
このスクリプトのソースコードは非公開で投稿されています。 ただし、制限なく自由に使用できます – 詳細はこちらでご確認ください。
免責事項
この情報および投稿は、TradingViewが提供または推奨する金融、投資、トレード、その他のアドバイスや推奨を意図するものではなく、それらを構成するものでもありません。詳細は利用規約をご覧ください。