OPEN-SOURCE SCRIPT
ABC Pattern
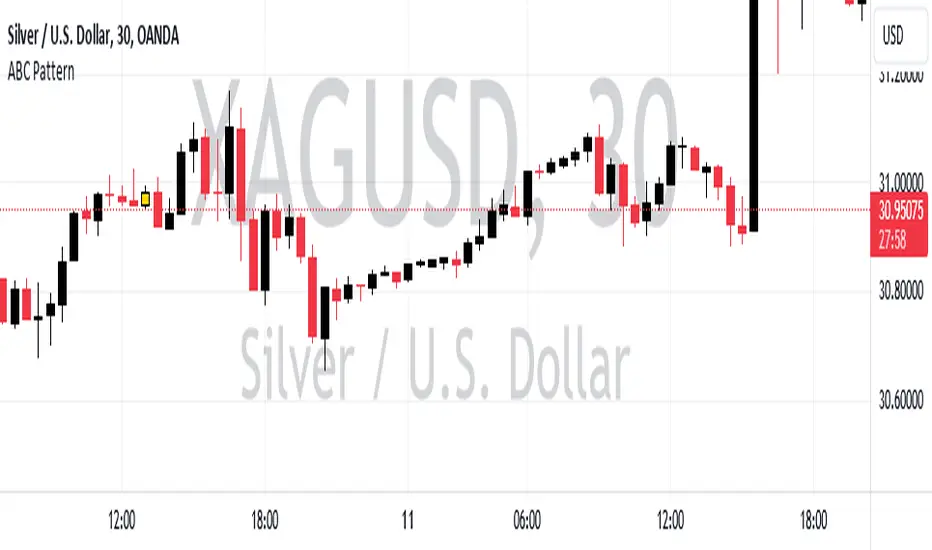
The indicator, named "ABC Pattern," is designed to identify specific bullish and bearish patterns on a price chart. Here's a simple explanation of what it does:
What the Indicator Does:
1. Identifies Bullish Patterns:
- The indicator looks for a sequence of candles where certain conditions are met to form a bullish pattern.
- When it detects a bullish pattern, it colors the candle that occurred three periods ago in gold.
2. Identifies Bearish Patterns:
- Similarly, it looks for a sequence of candles where certain conditions are met to form a bearish pattern.
- When it detects a bearish pattern, it colors the candle that occurred three periods ago in pinkish.
3. Creates Alerts:
- Whenever a bullish or bearish pattern is identified, the indicator generates an alert.
- The alert message includes the type of pattern (bullish or bearish), the price level at the time of detection, and the date and time of the pattern formation.
Detailed Conditions:
- Bullish Pattern:
- The current candle closes higher than it opened.
- The previous candle also closes higher than it opened.
- Two candles ago, the candle closed lower than it opened.
- Three candles ago, the candle closed higher than it opened.
- The highest price of two candles ago is below the current close.
- The lowest price of three candles ago is above the close of two candles ago.
- The highest price of three candles ago is below the current close.
- Bearish Pattern:
- The current candle closes lower than it opened.
- The previous candle also closes lower than it opened.
- Two candles ago, the candle closed higher than it opened.
- Three candles ago, the candle closed lower than it opened.
- The lowest price of two candles ago is above the current close.
- The highest price of three candles ago is below the close of two candles ago.
- The lowest price of three candles ago is above the current close.
Visual Representation:
- Gold Color: Indicates a detected bullish pattern.
- Pinkish Color: Indicates a detected bearish pattern.
Alerts:
- Alert Message: "ABC Pattern has appeared!"
- Detailed Alerts: Include the type of pattern, price level, and timestamp for better analysis and decision-making.
This indicator helps traders visually and audibly detect potential bullish and bearish patterns on their charts, aiding in making more informed trading decisions.
オープンソーススクリプト
TradingViewの精神に則り、このスクリプトの作者はコードをオープンソースとして公開してくれました。トレーダーが内容を確認・検証できるようにという配慮です。作者に拍手を送りましょう!無料で利用できますが、コードの再公開はハウスルールに従う必要があります。
免責事項
この情報および投稿は、TradingViewが提供または推奨する金融、投資、トレード、その他のアドバイスや推奨を意図するものではなく、それらを構成するものでもありません。詳細は利用規約をご覧ください。
オープンソーススクリプト
TradingViewの精神に則り、このスクリプトの作者はコードをオープンソースとして公開してくれました。トレーダーが内容を確認・検証できるようにという配慮です。作者に拍手を送りましょう!無料で利用できますが、コードの再公開はハウスルールに従う必要があります。
免責事項
この情報および投稿は、TradingViewが提供または推奨する金融、投資、トレード、その他のアドバイスや推奨を意図するものではなく、それらを構成するものでもありません。詳細は利用規約をご覧ください。