PROTECTED SOURCE SCRIPT
更新済 Momentum Traders Toolbox PRO
Momentum Traders Toolbox PRO
Description:
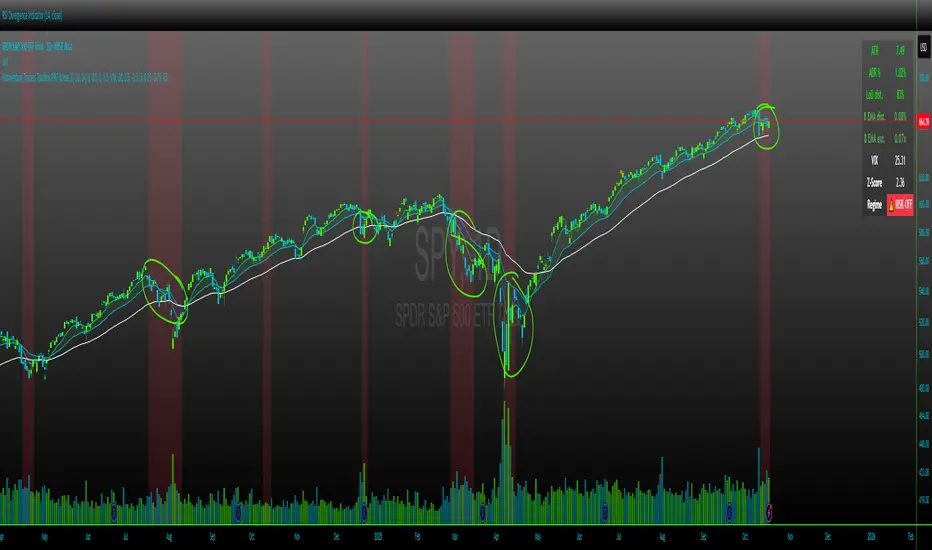
Momentum Traders Toolbox PRO is a comprehensive trading dashboard that combines daily moving averages, volatility metrics, and average daily range analysis into a single overlay for active traders. Designed for both swing traders and intraday momentum traders, this tool helps visualize key price levels, trend direction, and market risk in real-time.
Key Features:
Daily EMAs & Bands
Plots 8, 21, and 50-day EMAs directly on the chart.
Highlights the EMA band between 8 and 21 EMAs with dynamic coloring for the buyers cloud, when markets are shaky, but wanting to enter into a position on a high momentum stock in a hot sector, these are key areas buyers show up.
ADR (Average Daily Range) Analysis
Displays ADR% and ATR values for daily volatility.
Calculates distance from daily lows and EMA levels, helping identify potential entry/exit points.
Shows EMA extension relative to ADR, highlighting overextended or balanced conditions.
VIX Z-Score Integration
Monitors the CBOE VIX with daily Z-Score to indicate market volatility regimes.
Displays a “RISK-ON / NEUTRAL / RISK-OFF” signal.
Helps traders align trades with overall market sentiment.
Customizable Table Overlay
Provides a clean, real-time table with ATR, ADR%, LoD distance, EMA distance, EMA extension, and VIX data.
Table text and background colors are fully customizable.
Works on intraday charts while locking VIX and ADR calculations to daily values.
Visual Alerts
Color-coded EMA bands and table metrics for quick identification of momentum shifts.
Easily distinguish between extended, slightly extended, and balanced price conditions using configurable thresholds.
Benefits:
Quickly identify high-probability momentum trades without switching between multiple indicators.
Reduce risk exposure by factoring in VIX-driven market conditions.
Fully customizable visuals allow for personalized trading setups.
Recommended Use:
Best used on daily and hourly timeframes, with daily EMA, ADR, and VIX calculations.
Use in conjunction with price action and volume analysis for momentum-based entries.
Ideal for swing traders and intraday traders who want a clear view of trend and volatility simultaneously.
Description:
Momentum Traders Toolbox PRO is a comprehensive trading dashboard that combines daily moving averages, volatility metrics, and average daily range analysis into a single overlay for active traders. Designed for both swing traders and intraday momentum traders, this tool helps visualize key price levels, trend direction, and market risk in real-time.
Key Features:
Daily EMAs & Bands
Plots 8, 21, and 50-day EMAs directly on the chart.
Highlights the EMA band between 8 and 21 EMAs with dynamic coloring for the buyers cloud, when markets are shaky, but wanting to enter into a position on a high momentum stock in a hot sector, these are key areas buyers show up.
ADR (Average Daily Range) Analysis
Displays ADR% and ATR values for daily volatility.
Calculates distance from daily lows and EMA levels, helping identify potential entry/exit points.
Shows EMA extension relative to ADR, highlighting overextended or balanced conditions.
VIX Z-Score Integration
Monitors the CBOE VIX with daily Z-Score to indicate market volatility regimes.
Displays a “RISK-ON / NEUTRAL / RISK-OFF” signal.
Helps traders align trades with overall market sentiment.
Customizable Table Overlay
Provides a clean, real-time table with ATR, ADR%, LoD distance, EMA distance, EMA extension, and VIX data.
Table text and background colors are fully customizable.
Works on intraday charts while locking VIX and ADR calculations to daily values.
Visual Alerts
Color-coded EMA bands and table metrics for quick identification of momentum shifts.
Easily distinguish between extended, slightly extended, and balanced price conditions using configurable thresholds.
Benefits:
Quickly identify high-probability momentum trades without switching between multiple indicators.
Reduce risk exposure by factoring in VIX-driven market conditions.
Fully customizable visuals allow for personalized trading setups.
Recommended Use:
Best used on daily and hourly timeframes, with daily EMA, ADR, and VIX calculations.
Use in conjunction with price action and volume analysis for momentum-based entries.
Ideal for swing traders and intraday traders who want a clear view of trend and volatility simultaneously.
リリースノート
Description:Momentum Traders Toolbox PRO is a comprehensive trading dashboard that combines daily moving averages, volatility metrics, and average daily range analysis into a single overlay for active traders. Designed for both swing traders and intraday momentum traders, this tool helps visualize key price levels, trend direction, and market risk in real-time.
Key Features:
Daily EMAs & Bands
Plots 8, 21, and 50-day EMAs directly on the chart.
Highlights the EMA band between 8 and 21 EMAs with dynamic coloring for the buyers cloud, when markets are shaky, but wanting to enter into a position on a high momentum stock in a hot sector, these are key areas buyers show up.
ADR (Average Daily Range) Analysis
Displays ADR% and ATR values for daily volatility.
Calculates distance from daily lows and EMA levels, helping identify potential entry/exit points.
Shows EMA extension relative to ADR, highlighting overextended or balanced conditions.
VIX Z-Score Integration
Monitors the CBOE VIX with daily Z-Score to indicate market volatility regimes.
Displays a “RISK-ON / NEUTRAL / RISK-OFF” signal.
Helps traders align trades with overall market sentiment.
Customizable Table Overlay
Provides a clean, real-time table with ATR, ADR%, LoD distance, EMA distance, EMA extension, and VIX data.
Table text and background colors are fully customizable.
Works on intraday charts while locking VIX and ADR calculations to daily values.
Visual Alerts
Color-coded EMA bands and table metrics for quick identification of momentum shifts.
Easily distinguish between extended, slightly extended, and balanced price conditions using configurable thresholds.
Benefits:
Quickly identify high-probability momentum trades without switching between multiple indicators.
Reduce risk exposure by factoring in VIX-driven market conditions.
Fully customizable visuals allow for personalized trading setups.
Recommended Use:
Best used on daily and hourly timeframes, with daily EMA, ADR, and VIX calculations.
Use in conjunction with price action and volume analysis for momentum-based entries.
Ideal for swing traders and intraday traders who want a clear view of trend and volatility simultaneously.
リリースノート
Added Vix price threshold to risk off status.保護スクリプト
このスクリプトのソースコードは非公開で投稿されています。 ただし、制限なく自由に使用できます – 詳細はこちらでご確認ください。
免責事項
この情報および投稿は、TradingViewが提供または推奨する金融、投資、トレード、その他のアドバイスや推奨を意図するものではなく、それらを構成するものでもありません。詳細は利用規約をご覧ください。
保護スクリプト
このスクリプトのソースコードは非公開で投稿されています。 ただし、制限なく自由に使用できます – 詳細はこちらでご確認ください。
免責事項
この情報および投稿は、TradingViewが提供または推奨する金融、投資、トレード、その他のアドバイスや推奨を意図するものではなく、それらを構成するものでもありません。詳細は利用規約をご覧ください。