INVITE-ONLY SCRIPT
更新済 (CM|DB) Caruso Market Dashboard
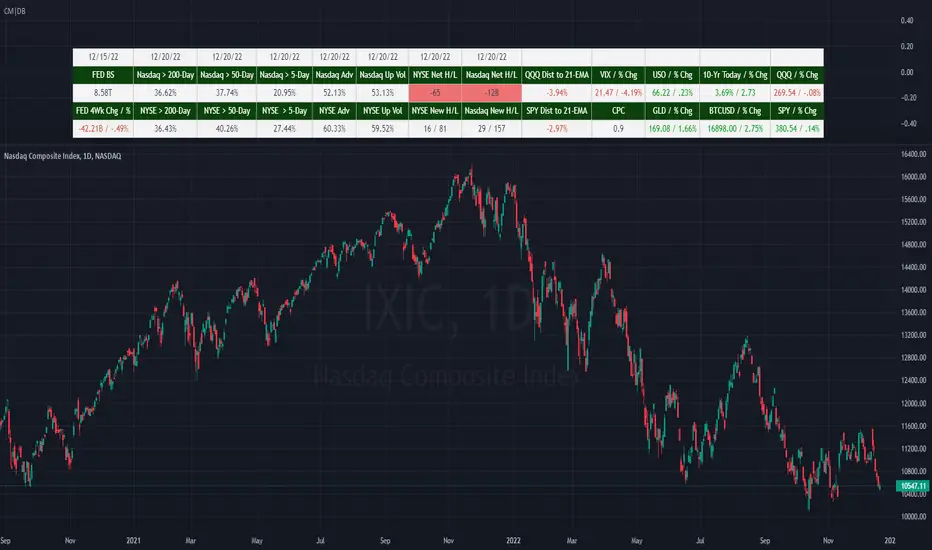
The Caruso Market Dashboard (CM|DB) provides a snapshot of key US market data, market internals (breadth), and economic statistics. It displays real-time prices of seven major markets along with daily updates of the put/call ratio and multiple breadth measurements. Lastly, it displays the Federal Reserve’s balance sheet and 4-week change of assets held to help investors keep abreast of important FED changes in policy.
Presented for both the Nasdaq and NYSE composites and updated at the end of each trading day, the market breadth section shows:
· the number of net 52-week highs and lows
· the actual number of new 52-week highs and 52-week lows.
· The percentage of volume traded on up stocks vs. total volume
· The percentage of stocks advancing vs. all stocks
· Percentage of stocks above their 5-day average
· Percentage of stocks above their 50-day average
· Percentage of stocks above their 200-day average
In addition to presenting all of this valuable information in a table, users can hide the table and plot each market and economic data point. This is very helpful when viewing trends as well as overbought and oversold levels for these data points.
リリースノート
Version 2.0■ Intraday support.
■ Add option to change market data symbols.
リリースノート
Bug Fix■ The SPY cell now correctly displays text green or red depending on the daily change.
■ New symbol names now display correctly if the dashboard's breadth stats are not shown
招待専用スクリプト
このスクリプトは作者が承認したユーザーのみアクセス可能です。使用するにはアクセス申請をして許可を得る必要があります。通常は支払い後に承認されます。詳細は下記の作者の指示に従うか、CarusoInsightsに直接お問い合わせください。
TradingViewは、作者を完全に信頼し、スクリプトの動作を理解していない限り、有料スクリプトの購入・使用を推奨しません。コミュニティスクリプトには無料のオープンソースの代替が多数あります。
作者の指示
Get access to CarusoInsights indicators: https://www.carusoinsights.com/charting/
Get access to CarusoInsights indicators: carusoinsights.com/charting/
免責事項
この情報および投稿は、TradingViewが提供または推奨する金融、投資、トレード、その他のアドバイスや推奨を意図するものではなく、それらを構成するものでもありません。詳細は利用規約をご覧ください。