PROTECTED SOURCE SCRIPT
Manual Vertical Lines (ramlakshman das)
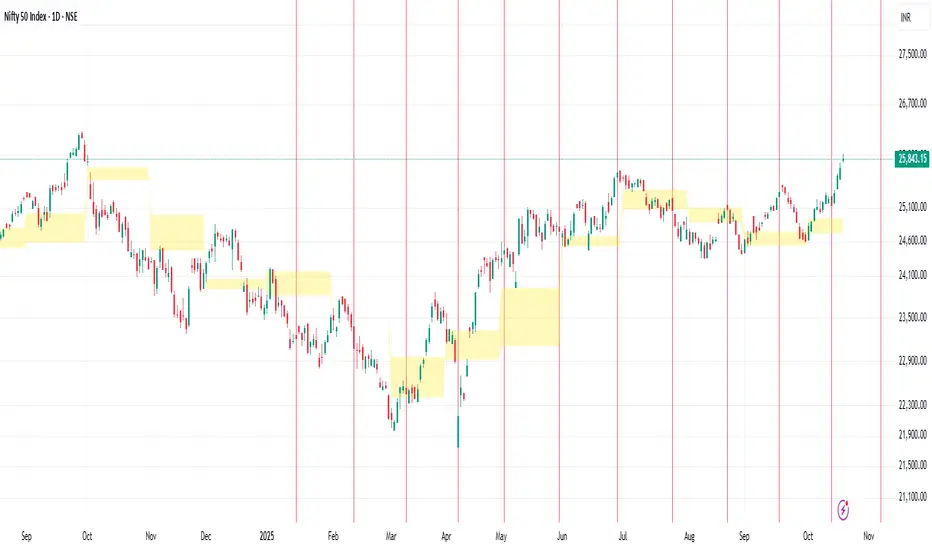
This script is useful for traders who want to visually mark important past or upcoming events such as earnings announcements, market opens/closes, or economic dates directly on their price charts. Its manual input format offers maximal customization for each individual line without loops, making it straightforward to fine-tune each line’s parameters individually.
Key features include:
Manual control over up to multiple vertical lines.
Support for any date and time with precise timestamp inputs.
Customizable line colors.
Persistence of lines into the future.
Clear, user-friendly input naming for ease of use.
This indicator helps traders visually track crucial dates and prepare for events by highlighting them on their charts, improving decision-making and situational awareness during trading.
保護スクリプト
このスクリプトのソースコードは非公開で投稿されています。 ただし、制限なく自由に使用できます – 詳細はこちらでご確認ください。
免責事項
この情報および投稿は、TradingViewが提供または推奨する金融、投資、トレード、その他のアドバイスや推奨を意図するものではなく、それらを構成するものでもありません。詳細は利用規約をご覧ください。
保護スクリプト
このスクリプトのソースコードは非公開で投稿されています。 ただし、制限なく自由に使用できます – 詳細はこちらでご確認ください。
免責事項
この情報および投稿は、TradingViewが提供または推奨する金融、投資、トレード、その他のアドバイスや推奨を意図するものではなく、それらを構成するものでもありません。詳細は利用規約をご覧ください。