PROTECTED SOURCE SCRIPT
Relative Strength Index + MTF VEIODORIO
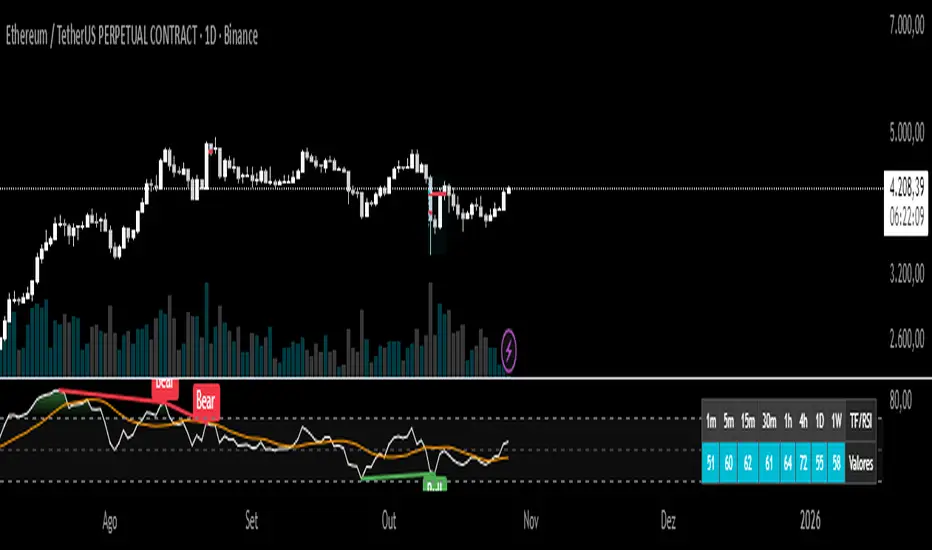
An advanced technical indicator that combines multiple RSI (Relative Strength Index) analysis features into a single, comprehensive tool.
Main Features:
1. Traditional RSI
Calculates the standard Relative Strength Index with a configurable period (default: 14)
Displays overbought and oversold levels
Includes colored background fill for better visualization
2. Multi-Timeframe (MTF) Chart
Displays RSI values simultaneously across 8 different timeframes:
1 minute, 5 minutes, 15 minutes, 30 minutes
1 hour, 4 hours, 1 day, 1 week
保護スクリプト
このスクリプトのソースコードは非公開で投稿されています。 ただし、制限なく自由に使用できます – 詳細はこちらでご確認ください。
免責事項
この情報および投稿は、TradingViewが提供または推奨する金融、投資、トレード、その他のアドバイスや推奨を意図するものではなく、それらを構成するものでもありません。詳細は利用規約をご覧ください。
免責事項
この情報および投稿は、TradingViewが提供または推奨する金融、投資、トレード、その他のアドバイスや推奨を意図するものではなく、それらを構成するものでもありません。詳細は利用規約をご覧ください。