PROTECTED SOURCE SCRIPT
Bar%Change
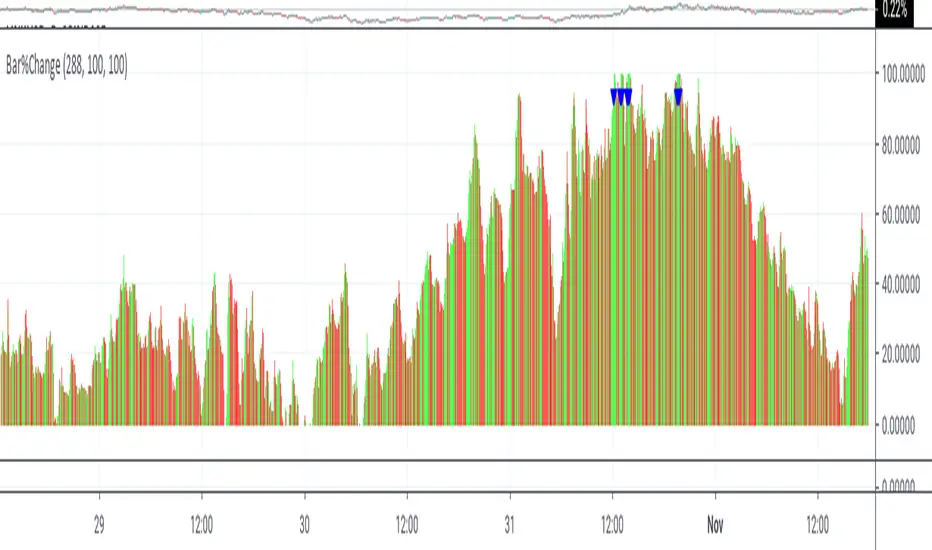
This is a visual study to hilight the change is candlestick by percentage. the percentages are calculated by the duration of the momentum. This study is not designed for automated trading.
The triangles show buys/sells on the basis of momentum. Buys occur below momentum, while sells occur above.
Percentages are shown in red if closing less then opening or closing less then previous closing, otherwise green.
Buying and selling changes in candlestick percentages are user configurable.
The triangles show buys/sells on the basis of momentum. Buys occur below momentum, while sells occur above.
Percentages are shown in red if closing less then opening or closing less then previous closing, otherwise green.
Buying and selling changes in candlestick percentages are user configurable.
保護スクリプト
このスクリプトのソースコードは非公開で投稿されています。 ただし、制限なく自由に使用できます – 詳細はこちらでご確認ください。
Join my Patreon for exclusive access to Jackrabbit TV,
patreon.com/RD3277
patreon.com/RD3277
免責事項
この情報および投稿は、TradingViewが提供または推奨する金融、投資、トレード、その他のアドバイスや推奨を意図するものではなく、それらを構成するものでもありません。詳細は利用規約をご覧ください。
保護スクリプト
このスクリプトのソースコードは非公開で投稿されています。 ただし、制限なく自由に使用できます – 詳細はこちらでご確認ください。
Join my Patreon for exclusive access to Jackrabbit TV,
patreon.com/RD3277
patreon.com/RD3277
免責事項
この情報および投稿は、TradingViewが提供または推奨する金融、投資、トレード、その他のアドバイスや推奨を意図するものではなく、それらを構成するものでもありません。詳細は利用規約をご覧ください。