INVITE-ONLY SCRIPT
更新済 TREND CIRCLE + DIVERGENCES overlay
TCD INDICATOR SUPEROverlay includes circle trend instruments, divergence detection, and based on stochastic & high/low applications. Modification of this oscillator is of course to get better signals in the trading strategy. Make it as simple as possible. Glad to be informed that this indicator is NON-REPAINT.
Another instrument included is supply and demand (SnD, OrderBlock) to complete the technical to facilitate users in trading activities.
=========================================
This indicator strategy is not suitable for the forex, stock, and crude oil markets. It’s only tested on FCPO and CRYPTO(BTC, ETH, BNB) markets.
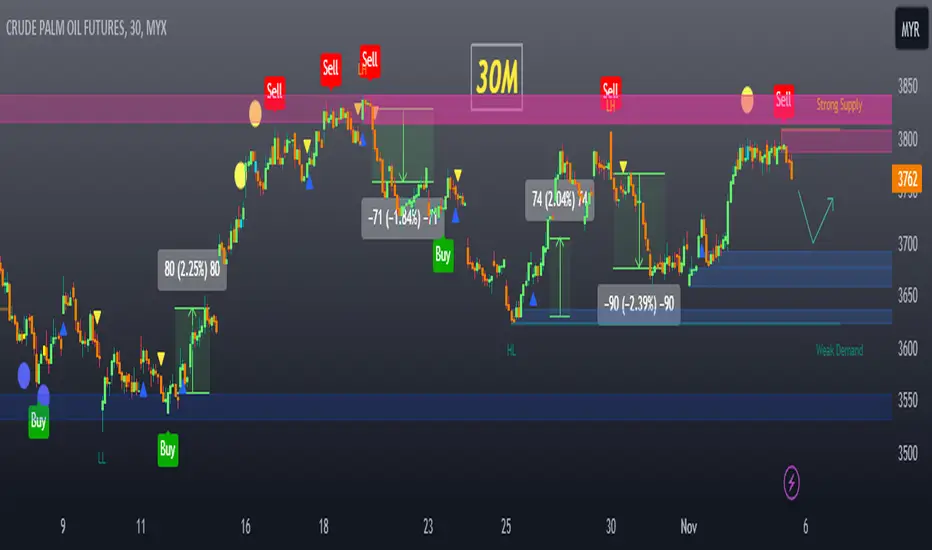
In fact, this indicator was built specifically for the Futures Crude Palm Oil ( FCPO ).
And it’s available for ANY TIMEFRAME. The selection of the time frame depends on the strategy. For example, the intraday strategy's appropriate time frame is 3M, 5M, and 15 minutes. For swing/overnight, 15M, 30M, 1H. The best-winning rates = 5M.
===========================================
The TCD INDICATOR ( wave trend ) follows swings in a volatile market which is why this particular indicator is very useful to identify the price at the bottom or the top and also be able to detect trend changes and divergences that occur.
Parameter that’s used
1. Stochastic Relative Strength Index
2. Moving Average ( Super Smooth)
3. Pivot point High-Low
4. Volume Threshold
==============================================
Key of indicator
a) Buy/Sell signals
= Regular divergence allows you to see a trend reversal or continuation. This is the
best signal to make decisions to sell short or buy long.
b) Blue/Yellow circles
= level of oversold/overbought. When it comes out, so trend potentially to reversal/changed.
Here we consider to buy/sell
c) Green/Red triangles
= They happen after oversold/overbought level. Here trend changes from the current trend.
It’s also for buy/sell signals for scalping.
d) Strong signals
= Strong buy/sell signals when both Red/Yellow circles and red Sell/green Buy
signals come out together. There is the best confirmation for the reversal of the
trend. Sometimes triangle signal also occurs. That was a Triple's signal.
e) Supply and Demand zone
= Blue line/background is supply zone and possibility for buy/target(TP) zone.
= Red line/background is demand zone and possibility for sell/target(TP) zone.
===============================================================
Display on the chart

Strong buy/sell

Day trading set-up

Swing set-up

DISCLAIMER:
All technical signals and strategies using this indicator are for educational purposes. Take it at your own risk.
Another instrument included is supply and demand (SnD, OrderBlock) to complete the technical to facilitate users in trading activities.
=========================================
This indicator strategy is not suitable for the forex, stock, and crude oil markets. It’s only tested on FCPO and CRYPTO(BTC, ETH, BNB) markets.
In fact, this indicator was built specifically for the Futures Crude Palm Oil ( FCPO ).
And it’s available for ANY TIMEFRAME. The selection of the time frame depends on the strategy. For example, the intraday strategy's appropriate time frame is 3M, 5M, and 15 minutes. For swing/overnight, 15M, 30M, 1H. The best-winning rates = 5M.
===========================================
The TCD INDICATOR ( wave trend ) follows swings in a volatile market which is why this particular indicator is very useful to identify the price at the bottom or the top and also be able to detect trend changes and divergences that occur.
Parameter that’s used
1. Stochastic Relative Strength Index
2. Moving Average ( Super Smooth)
3. Pivot point High-Low
4. Volume Threshold
==============================================
Key of indicator
a) Buy/Sell signals
= Regular divergence allows you to see a trend reversal or continuation. This is the
best signal to make decisions to sell short or buy long.
b) Blue/Yellow circles
= level of oversold/overbought. When it comes out, so trend potentially to reversal/changed.
Here we consider to buy/sell
c) Green/Red triangles
= They happen after oversold/overbought level. Here trend changes from the current trend.
It’s also for buy/sell signals for scalping.
d) Strong signals
= Strong buy/sell signals when both Red/Yellow circles and red Sell/green Buy
signals come out together. There is the best confirmation for the reversal of the
trend. Sometimes triangle signal also occurs. That was a Triple's signal.
e) Supply and Demand zone
= Blue line/background is supply zone and possibility for buy/target(TP) zone.
= Red line/background is demand zone and possibility for sell/target(TP) zone.
===============================================================
Display on the chart
Strong buy/sell
Day trading set-up
Swing set-up
DISCLAIMER:
All technical signals and strategies using this indicator are for educational purposes. Take it at your own risk.
リリースノート
fixing the weak/strong zonesリリースノート
added alert for trend cross-up/down extra MA ( triangle signals)リリースノート
Fix some errorsRemove plots that are stacked on the main chart
招待専用スクリプト
こちらのスクリプトにアクセスできるのは投稿者が承認したユーザーだけです。投稿者にリクエストして使用許可を得る必要があります。通常の場合、支払い後に許可されます。詳細については、以下、作者の指示をお読みになるか、TraderAsistに直接ご連絡ください。
このプライベートの招待専用スクリプトは、まだスクリプトモデレーターによるレビューを受けていません。ハウスルールに準拠しているかについては不明です。 スクリプトの機能を理解し、その作者を全面的に信頼しているのでなければ、お金を支払ってまでそのスクリプトを利用することをTradingViewとしては「非推奨」としています。コミュニティスクリプトの中で、その代わりとなる無料かつオープンソースのスクリプトを見つけられる可能性もあります。
作者の指示
Please contact admin for more information.
免責事項
これらの情報および投稿は、TradingViewが提供または保証する金融、投資、取引、またはその他の種類のアドバイスや推奨を意図したものではなく、またそのようなものでもありません。詳しくは利用規約をご覧ください。