PROTECTED SOURCE SCRIPT
Nexural QWAP
QWAP - Quantitative Weighted Average Price with True Order Flow Analysis
INTRODUCTION
This is legit one of the best indicators I can possibly make. Since I don't have access to tick data on tradingview I can't claim it's as accurate as possible but it is a very polished indicator for VWAP based trading and the bands are VERY useful for mean reverting trading.
QWAP Elite is an advanced Volume Weighted Average Price indicator that incorporates true order flow analysis through intrabar data decomposition. Unlike traditional VWAP indicators that simply calculate price multiplied by volume divided by total volume, this indicator attempts to identify the directional intent behind that volume by analyzing whether buying or selling pressure dominated each bar at a granular level.
The fundamental premise of this indicator is that not all volume is created equal. A bar with 10000 contracts where 8000 were aggressive buyers tells a very different story than a bar with 10000 contracts where 8000 were aggressive sellers, even if both bars close at the same price. Traditional VWAP treats these identically. QWAP attempts to weight the VWAP calculation based on this directional flow information.
This indicator was designed for traders who believe that institutional order flow leaves detectable footprints in price and volume data, and that identifying these footprints can provide an edge in determining likely future price direction. It is not a holy grail and it is not a replacement for proper risk management and trading discipline.
HOW THE INDICATOR WORKS
The True CVD Engine
The core of this indicator is its Cumulative Volume Delta calculation. Most indicators on TradingView approximate buying and selling volume by looking at whether a bar closed higher or lower than it opened. If the bar closed green, they assign all volume as buying volume. If it closed red, they assign all volume as selling volume. This is a crude approximation that misses significant nuance.
QWAP Elite uses the request security lower tf function to pull actual intrabar data. This means if you are on a 5 minute chart, the indicator is looking at the individual ticks or smaller timeframe bars that occurred within that 5 minute period. It then calculates how much volume occurred on up moves versus down moves within that bar, giving a much more accurate picture of whether buyers or sellers were more aggressive.
The Delta Ratio is calculated as the net delta divided by total volume, resulting in a value between negative one and positive one. A value of positive 0.6 means that 80 percent of volume was buying and 20 percent was selling. A value of negative 0.4 means that 70 percent was selling and 30 percent was buying. This ratio is then used to weight the VWAP calculation.
The intrabar precision is displayed in the dashboard as the number of bars analyzed. More bars means more granular data and theoretically more accurate delta calculation. The indicator automatically selects an appropriate lower timeframe based on your chart timeframe to balance accuracy with computational performance.
VIX Integration and Volatility Intelligence
The indicator pulls live VIX data and uses it to adjust its calculations dynamically. The VIX or CBOE Volatility Index represents the market expectation of 30 day forward looking volatility derived from SP500 option prices. When VIX is elevated, markets behave differently than when VIX is compressed.
Specifically, the indicator uses VIX to adjust the standard deviation bands around VWAP. In high volatility environments where VIX is above 25 or 30, the bands automatically widen to account for larger price swings. In low volatility environments where VIX is below 15, the bands tighten. This prevents false signals that would occur if static band widths were used across all market conditions.
The indicator also pulls VVIX which is the volatility of the VIX itself and VIX9D which is the 9 day VIX. By comparing VIX to VIX9D, the indicator can identify term structure conditions. When short term VIX is higher than longer term VIX, this is called backwardation and often indicates fear or stress in the market. When short term VIX is lower, this is contango and indicates complacency.
The VIX regime classification in the dashboard shows CALM when VIX is below 12, NORMAL between 12 and 20, ELEVATED between 20 and 30, and FEAR when above 30. Each regime suggests different trading approaches and position sizing considerations.
DETECTION SYSTEMS
Absorption Detection
Absorption occurs when large volume enters the market but price barely moves. This happens when one side is absorbing all the aggression from the other side. For example, if aggressive sellers are hitting the bid repeatedly but price is not dropping, it suggests there is a large buyer absorbing all that selling pressure. This often precedes reversals.
The indicator detects absorption by looking for bars with above average volume, below average range, and high wick ratios. A high wick ratio means the bar has long wicks relative to its body, indicating price moved but was pushed back. When these conditions coincide with strong delta in one direction, it suggests institutional absorption.
Liquidity Sweep Detection
Liquidity sweeps, also known as stop hunts, occur when price briefly exceeds a recent high or low to trigger stop losses, then reverses. Large traders need liquidity to fill their orders, and stops clustered above swing highs or below swing lows represent pools of liquidity they can tap into.
The indicator identifies sweeps by detecting when price exceeds the 5 or 20 bar high or low but closes back inside. A bull trap is identified when price sweeps above recent highs but closes below them, suggesting sellers trapped buyers who bought the breakout. A bear trap is the opposite, where price sweeps lows but closes above, trapping shorts.
Sweep detection is most useful when combined with delta analysis. A sweep with strong opposing delta, meaning price swept highs but delta was heavily negative, is a higher probability reversal signal than a sweep alone.
CVD Divergence Detection
Divergence between price and cumulative delta is one of the most reliable signals the indicator produces. When price is making higher highs but cumulative delta is making lower highs, it suggests that buying pressure is weakening even though price is still rising. This bearish divergence often precedes pullbacks or reversals.
Conversely, bullish divergence occurs when price makes lower lows but cumulative delta makes higher lows. This suggests that even though price is dropping, buying pressure is actually increasing, and sellers may be exhausted. These divergences are calculated over a 5 bar lookback period.
Stacked Imbalance Detection
Stacked imbalances occur when there are three or more consecutive bars with strong delta in the same direction. This represents sustained aggressive positioning by one side of the market. Three consecutive bars with delta above 0.5 suggests aggressive institutional buying. Three consecutive bars below negative 0.5 suggests aggressive institutional selling.
The count of consecutive imbalanced bars is displayed in the detection section. Four or more stacked imbalances is considered highly significant. This pattern often precedes continuation moves in the direction of the imbalance, as it suggests a committed directional player has entered the market.
Institutional Flow Detection
The indicator attempts to identify institutional activity by looking for the convergence of multiple factors. Specifically, it requires strong delta above 0.5 or below negative 0.5, volume persistence across multiple bars meaning above average volume for at least 2 to 3 bars in a row, and delta persistence meaning delta in the same direction for multiple consecutive bars.
When these factors align, the dashboard displays INST BUY or INST SELL instead of RETAIL. This classification should be viewed as a probability estimate rather than a certainty. Retail traders can produce similar patterns, and institutions can hide their activity. The designation is meant to highlight periods where the characteristics of flow are consistent with larger players.
ADAPTIVE WEIGHT SYSTEM
The indicator includes an adaptive system that automatically adjusts how much weight the CVD analysis has on the VWAP calculation. In quiet, low volatility markets, the CVD weight is reduced because the signal to noise ratio is lower. In active, high volatility markets with clear directional flow, the weight is increased.
The adaptation considers multiple factors including VIX regime, delta clarity meaning how strong and consistent the delta readings are, volume persistence, and time of day session weighting. The current adaptive weight is displayed in the dashboard and typically ranges from 0.05 to 0.50.
The adaptation speed setting controls how quickly the weight responds to changing conditions. A higher speed means faster adaptation but potentially more noise. A lower speed means smoother adaptation but potentially slower response to regime changes.
SESSION AWARENESS
Not all trading hours are equal. The indicator applies different weights to different trading sessions based on typical liquidity and reliability patterns. The open drive, which covers 9 30 to 10 30 AM Eastern time, receives a 1.4x weight multiplier because this is typically the highest volume and most directionally significant period of the day.
Power hour from 3 00 to 4 00 PM Eastern receives a 1.3x multiplier as institutional traders often execute their daily positioning in this final hour. The lunch hour from 11 00 AM to 2 00 PM receives a 0.9x multiplier due to typically lower volume and more choppy price action. Premarket receives 0.7x and after hours receives 0.5x due to thin liquidity and unreliable signals.
The current session is displayed in the dashboard header. Traders should consider reducing position sizes and widening stops during lower weight sessions, particularly premarket and after hours where the indicator readings are less reliable.
COMPOSITE SCORES
Bias Score
The Bias Score ranges from negative 100 to positive 100 and represents the indicators overall directional lean. It synthesizes delta analysis, VWAP momentum, and multi-timeframe confluence into a single number. A score above 50 indicates strong bullish bias. A score below negative 50 indicates strong bearish bias. Scores between negative 20 and positive 20 are considered neutral.
The visual bias meter in the dashboard shows this score as a bar that leans left for bearish or right for bullish. This provides an at a glance summary of the indicators current directional reading without needing to interpret multiple individual metrics.
Setup Quality Score
The Setup Quality Score ranges from 0 to 100 and measures how many factors are aligning to support a potential trade. It awards points for strong delta readings, volume persistence, multi-timeframe confluence, detection events like absorption or divergence, and favorable session timing. A score above 60 suggests multiple factors are confirming. A score below 30 suggests the setup lacks confirmation.
This score is designed to help traders filter trades. Rather than acting on every signal, traders can set a minimum quality threshold. For example, only taking trades when quality is above 50 will filter out lower probability setups. Higher thresholds mean fewer trades but potentially higher win rates.
Heat Score
The Heat Score measures overall market activity intensity and ranges from 0 to 100. It combines volume heat meaning how elevated current volume is relative to average, volatility heat based on ATR expansion or VIX levels, delta heat meaning how strong the current delta reading is, and deviation heat meaning how far price is from VWAP.
Markets with heat above 75 are classified as EXTREME and typically represent high opportunity but also high risk environments. Heat between 50 and 75 is ACTIVE and represents good trading conditions. Heat between 25 and 50 is NORMAL. Heat below 25 is QUIET and suggests range bound conditions where mean reversion strategies may outperform trend following.
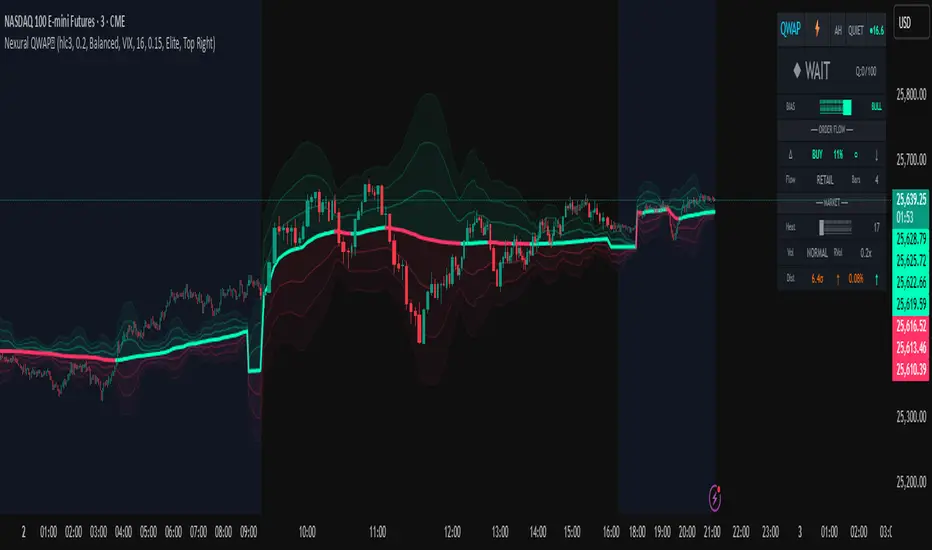
DASHBOARD GUIDE
Header Row
The header row displays QWAP with a lightning bolt icon, the current session abbreviation like OPEN or POWER or LUNCH, the current regime classification, and VIX status with a colored indicator. Green indicates low VIX and favorable conditions. Yellow indicates elevated VIX. Red indicates high VIX or that VIX data is unavailable.
Signal Row
The signal row is the largest and most prominent element. It displays the primary signal which will be LONG, SHORT, REVERSAL, or WAIT. LONG appears when bias is strongly bullish and quality is high. SHORT appears when bias is strongly bearish and quality is high. REVERSAL appears when divergence or absorption is detected at an extreme sigma level. WAIT appears when conditions do not meet the threshold for a signal.
Next to the signal is the quality score displayed as Q followed by a number out of 100. This helps traders quickly assess how confirmed the signal is. A LONG signal with Q 72 is more compelling than a LONG signal with Q 45.
Order Flow Section
The delta row shows the current delta direction as BUY or SELL, the percentage strength, a visual indicator of strength with filled or empty circles, and an arrow indicating whether delta is accelerating or decelerating. The flow row shows whether activity is classified as INST BUY, INST SELL, or RETAIL, along with the number of intrabar data points used in the calculation.
Market Section
The heat row displays the heat score as a visual bar and numeric value. The vol row shows volatility state as EXPAND, COMPRESS, or NORMAL along with relative volume. The dist row shows distance from VWAP in sigmas and percentage, plus momentum direction.
Detection Section
This section only appears when detections are active. It displays warning icons next to detection types like BUY ABS, SELL ABS, BULL TRAP, BEAR TRAP, BULL DIV, BEAR DIV, BUY STACK, or SELL STACK. Each detection includes a score representing its strength or significance.
HOW TO USE THIS INDICATOR
Recommended Workflow
First, check the regime and session. If VIX is in FEAR mode or you are in premarket or after hours, consider reduced position sizing or waiting for better conditions.
Second, look at the primary signal and quality score. Signals with quality below 40 are low conviction. Consider requiring quality above 50 or 60 before acting.
Third, check the bias meter for overall directional lean. Ensure it aligns with your intended trade direction.
Fourth, review active detections. Absorption and divergence near VWAP bands increase reversal probability. Stacked imbalances support continuation.
Fifth, use VWAP and sigma bands for entry, stop, and target placement. The bands provide natural support and resistance levels based on statistical distribution.
Sixth, monitor for changes in delta and flow classification. Institutional activity transitioning to retail or delta reversing direction are warning signs.
TRADE EXAMPLES
Mean Reversion Setup
Price extended to 2.5 sigma above VWAP. Signal shows REVERSAL. Quality is 55. Absorption detected with BUY ABS showing score of 2.3. Delta is showing SELL at 45 percent despite price being elevated. This suggests buyers are being absorbed and a pullback to VWAP is likely. Enter short with stop above the 3 sigma band and target at VWAP or 1 sigma band.
Trend Continuation Setup
Signal shows LONG with quality 68. Bias meter shows STRONG BULL. BUY STACK detected with 4 consecutive imbalanced bars. Flow shows INST BUY. Price has pulled back to VWAP and is finding support. Heat is at 62 indicating ACTIVE conditions. Enter long on VWAP touch with stop below 1 sigma band and target at 2 sigma band.
Liquidity Sweep Setup
BEAR TRAP detected with score of 1.8. Price swept below recent lows but closed back above. Delta is showing BUY at 52 percent on the sweep bar. BULL DIV also active as price made lower low but delta made higher low. Signal shows REVERSAL with quality 58. Enter long with stop below the sweep low and target at VWAP.
HONEST ASSESSMENT OF STRENGTHS AND WEAKNESSES
Strengths
True CVD calculation using intrabar data is significantly more accurate than close greater than open approximations used by most indicators. This provides genuine insight into buying versus selling pressure.
VIX integration with term structure analysis is institutional grade thinking applied to a retail tool. Dynamic band adjustment prevents false signals in different volatility regimes.
Multiple detection systems provide different perspectives on the same market. Absorption, sweeps, divergence, and imbalances each capture different footprints of institutional activity.
Composite scores synthesize complex information into actionable numbers. Traders do not need to mentally integrate 15 different metrics. The quality score and bias score do this automatically.
Session awareness prevents trading during low quality periods. The automatic weighting helps filter out noise from premarket, after hours, and lunch periods.
Adaptive system self adjusts to market conditions. Traders do not need to manually tune parameters as volatility and activity change.
Weaknesses and Limitations
Intrabar data is still an approximation of true tick level order flow. Without actual tick data showing individual trades hitting bid versus lifting offer, even this calculation has error bars. Professional platforms like Sierra Chart or Quantower with direct exchange feeds will always have more accurate delta.
The indicator is computationally heavy. Users may experience slower chart loading particularly on lower end hardware or when viewing many bars. The optimization features help but cannot eliminate this cost entirely.
Institutional detection is probabilistic not definitive. Retail traders in aggregate can produce patterns that look institutional. Institutions can and do hide their activity. The INST BUY and INST SELL labels should be viewed as probability shifts not certainties.
The indicator works best on liquid instruments with significant volume. On thinly traded stocks or during illiquid periods, delta calculations become noisy and unreliable. The indicator is optimized for ES, NQ, SPY, QQQ, and similar high volume instruments.
VIX integration only works for US equity index products. If trading forex, crypto, or other asset classes, the VIX data is not directly applicable and should be disabled.
No indicator can predict the future. Order flow analysis shows what happened and what is happening. It cannot guarantee what will happen next. Large players can and do reverse their positioning. News events can invalidate any technical setup instantly.
The complexity of the indicator means there is a learning curve. New users may be overwhelmed by the number of metrics displayed. It takes time to develop intuition for what combinations of readings are significant.
The indicator does not include automated backtesting or historical performance statistics. Users cannot easily quantify the win rate or expected value of following its signals without manual journaling and analysis.
RISK MANAGEMENT GUIDELINES
This indicator is a tool not a trading system. It provides information that may help inform trading decisions but it does not make those decisions for you. Proper risk management is essential regardless of how compelling the indicator readings appear.
Position Sizing
Never risk more than 1 to 2 percent of your account on any single trade regardless of how high the quality score is. High quality setups still fail regularly. A setup with 70 percent win rate still loses 30 percent of the time, and those losses can come in clusters.
Consider reducing position size when VIX is in ELEVATED or FEAR regime, when trading during premarket or after hours sessions, when quality score is below 50, and when multiple detection systems are conflicting with each other.
Stop Loss Placement
The sigma bands provide natural levels for stop placement. For mean reversion trades, stops should typically be placed beyond the next sigma level. For example, if entering short at 2 sigma, place stop beyond 3 sigma. For trend trades entering at VWAP, consider stops beyond 1 sigma in the opposite direction.
Stops should also respect market structure. If there is a recent swing high or low near your calculated stop level, extend the stop beyond that swing point. Placing stops at obvious levels invites stop hunting.
In high VIX environments, consider wider stops. The VIX band multiplier automatically widens the sigma bands, and your stops should reflect this increased volatility. A stop that works in a 15 VIX environment may be too tight when VIX is 30.
Taking Profits
The sigma bands also provide natural profit targets. For mean reversion trades, VWAP itself is often the first target with the opposite 1 sigma band as an extended target. For trend trades, each sigma band can serve as a scaling point.
Pay attention to delta and flow changes as price approaches targets. If delta is weakening or flow classification shifts from institutional to retail, consider taking profits early. Conversely, if delta is strengthening into the target, consider holding for extension.
When to Avoid Trading
Consider sitting out when the signal shows WAIT and quality is below 30. In these conditions, the indicator is essentially saying there is no clear edge. Trading anyway is gambling not trading.
Avoid trading during major news events. The indicator cannot account for sudden information shocks. Economic releases, Fed announcements, earnings reports, and geopolitical events can invalidate any technical setup instantly.
Consider avoiding the first and last 5 minutes of regular trading hours. These periods often have erratic price action and unreliable delta calculations due to order imbalances at open and close.
SETTINGS REFERENCE
Core Engine Settings
VWAP Source determines what price is used for the VWAP calculation. The default HLC3 uses the average of high, low, and close which provides a balanced representation. HL2 uses just high and low average. Close uses only the closing price. Most traders should leave this at HLC3.
True CVD Engine should remain enabled for accurate order flow analysis. Disabling it falls back to close greater than open estimation which is significantly less accurate. Only disable if you are experiencing performance issues.
CVD Impact controls how much the delta analysis affects the VWAP calculation. Higher values mean delta has more influence. The default 0.2 provides a balance. Increase toward 0.5 if you want delta to have stronger effect. Decrease toward 0.1 if you want something closer to traditional VWAP.
Detection Sensitivity offers three presets. Conservative produces fewer signals but higher confidence. Balanced is the default middle ground. Aggressive produces more signals but with more false positives. New users should start with Balanced and adjust based on experience.
VIX Settings
VIX Integration should be enabled when trading US equity index products like ES, NQ, SPY, or QQQ. Disable it when trading forex, crypto, commodities, or individual stocks where VIX is not directly applicable.
VIX Symbol allows selection between VIX for SP500 volatility, VXN for Nasdaq volatility, and RVX for Russell 2000 volatility. Choose the one most relevant to your trading instrument.
VIX Baseline sets the historical average VIX level used for normalization. The default 16 represents the long term average. If trading in a persistently higher or lower VIX environment, adjusting this can help calibrate the regime classifications.
Display Settings
Dashboard Style offers three options. Compact shows only the signal and bias meter for minimal screen footprint. Elite adds order flow and market sections for balanced information. Full adds VIX details, detections, and adaptive system information for complete visibility.
FREQUENTLY ASKED QUESTIONS
Why does the indicator sometimes show WAIT when there is an obvious trend
The signal system is designed to identify high probability entry points not to constantly indicate trend direction. A strong uptrend may show WAIT because price is extended from VWAP and a pullback is likely before continuation. The indicator is trying to prevent you from buying the top of an impulse move.
Why is my delta reading different from another order flow tool
Different platforms calculate delta differently. Some use tick data. Some use time based aggregation. Some use volume based aggregation. The timeframe being analyzed matters as well. QWAP uses intrabar data which is more accurate than close versus open approximations but less accurate than true tick data from professional platforms.
Can I use this indicator for scalping
The indicator can be used on lower timeframes but becomes less reliable. On 1 minute charts, the intrabar decomposition has fewer data points to work with. For scalping, consider using 3 to 5 minute charts as a minimum. Also note that the session weighting and detection systems are calibrated for swing and intraday trading, not ultra short term scalping.
Does this indicator repaint
The VWAP line and sigma bands can adjust slightly as intrabar data comes in during a live bar. Once a bar closes, those values are fixed. The signals and detections are calculated on closed bars and do not repaint. For live trading, wait for bar close confirmation before acting on signals.
What markets does this work best on
The indicator is optimized for high liquidity US equity index products including ES, NQ, SPY, QQQ, IWM, and DIA. It can work on other liquid instruments but the VIX integration should be disabled for non equity products. Avoid using on low volume stocks or illiquid markets where delta calculations will be noisy.
DISCLAIMER
This indicator is provided for educational and informational purposes only. It is not financial advice. Past performance of any trading methodology is not indicative of future results. Trading futures, options, and other derivatives involves substantial risk of loss and is not suitable for all investors.
The creator of this indicator makes no guarantees about its accuracy or profitability. All trading decisions are the sole responsibility of the user. Before trading with real money, thoroughly test any strategy in simulation and ensure you understand the risks involved.
Order flow analysis provides information about market microstructure but cannot predict future price movements with certainty. Markets are complex adaptive systems influenced by countless variables including news events, economic data, central bank policy, geopolitical developments, and collective human psychology. No indicator can fully capture this complexity.
Use this tool as one input among many in your trading process. Combine it with sound risk management, proper position sizing, and continuous education. The best traders are those who remain humble about what they do not know and disciplined about protecting their capital.
INTRODUCTION
This is legit one of the best indicators I can possibly make. Since I don't have access to tick data on tradingview I can't claim it's as accurate as possible but it is a very polished indicator for VWAP based trading and the bands are VERY useful for mean reverting trading.
QWAP Elite is an advanced Volume Weighted Average Price indicator that incorporates true order flow analysis through intrabar data decomposition. Unlike traditional VWAP indicators that simply calculate price multiplied by volume divided by total volume, this indicator attempts to identify the directional intent behind that volume by analyzing whether buying or selling pressure dominated each bar at a granular level.
The fundamental premise of this indicator is that not all volume is created equal. A bar with 10000 contracts where 8000 were aggressive buyers tells a very different story than a bar with 10000 contracts where 8000 were aggressive sellers, even if both bars close at the same price. Traditional VWAP treats these identically. QWAP attempts to weight the VWAP calculation based on this directional flow information.
This indicator was designed for traders who believe that institutional order flow leaves detectable footprints in price and volume data, and that identifying these footprints can provide an edge in determining likely future price direction. It is not a holy grail and it is not a replacement for proper risk management and trading discipline.
HOW THE INDICATOR WORKS
The True CVD Engine
The core of this indicator is its Cumulative Volume Delta calculation. Most indicators on TradingView approximate buying and selling volume by looking at whether a bar closed higher or lower than it opened. If the bar closed green, they assign all volume as buying volume. If it closed red, they assign all volume as selling volume. This is a crude approximation that misses significant nuance.
QWAP Elite uses the request security lower tf function to pull actual intrabar data. This means if you are on a 5 minute chart, the indicator is looking at the individual ticks or smaller timeframe bars that occurred within that 5 minute period. It then calculates how much volume occurred on up moves versus down moves within that bar, giving a much more accurate picture of whether buyers or sellers were more aggressive.
The Delta Ratio is calculated as the net delta divided by total volume, resulting in a value between negative one and positive one. A value of positive 0.6 means that 80 percent of volume was buying and 20 percent was selling. A value of negative 0.4 means that 70 percent was selling and 30 percent was buying. This ratio is then used to weight the VWAP calculation.
The intrabar precision is displayed in the dashboard as the number of bars analyzed. More bars means more granular data and theoretically more accurate delta calculation. The indicator automatically selects an appropriate lower timeframe based on your chart timeframe to balance accuracy with computational performance.
VIX Integration and Volatility Intelligence
The indicator pulls live VIX data and uses it to adjust its calculations dynamically. The VIX or CBOE Volatility Index represents the market expectation of 30 day forward looking volatility derived from SP500 option prices. When VIX is elevated, markets behave differently than when VIX is compressed.
Specifically, the indicator uses VIX to adjust the standard deviation bands around VWAP. In high volatility environments where VIX is above 25 or 30, the bands automatically widen to account for larger price swings. In low volatility environments where VIX is below 15, the bands tighten. This prevents false signals that would occur if static band widths were used across all market conditions.
The indicator also pulls VVIX which is the volatility of the VIX itself and VIX9D which is the 9 day VIX. By comparing VIX to VIX9D, the indicator can identify term structure conditions. When short term VIX is higher than longer term VIX, this is called backwardation and often indicates fear or stress in the market. When short term VIX is lower, this is contango and indicates complacency.
The VIX regime classification in the dashboard shows CALM when VIX is below 12, NORMAL between 12 and 20, ELEVATED between 20 and 30, and FEAR when above 30. Each regime suggests different trading approaches and position sizing considerations.
DETECTION SYSTEMS
Absorption Detection
Absorption occurs when large volume enters the market but price barely moves. This happens when one side is absorbing all the aggression from the other side. For example, if aggressive sellers are hitting the bid repeatedly but price is not dropping, it suggests there is a large buyer absorbing all that selling pressure. This often precedes reversals.
The indicator detects absorption by looking for bars with above average volume, below average range, and high wick ratios. A high wick ratio means the bar has long wicks relative to its body, indicating price moved but was pushed back. When these conditions coincide with strong delta in one direction, it suggests institutional absorption.
Liquidity Sweep Detection
Liquidity sweeps, also known as stop hunts, occur when price briefly exceeds a recent high or low to trigger stop losses, then reverses. Large traders need liquidity to fill their orders, and stops clustered above swing highs or below swing lows represent pools of liquidity they can tap into.
The indicator identifies sweeps by detecting when price exceeds the 5 or 20 bar high or low but closes back inside. A bull trap is identified when price sweeps above recent highs but closes below them, suggesting sellers trapped buyers who bought the breakout. A bear trap is the opposite, where price sweeps lows but closes above, trapping shorts.
Sweep detection is most useful when combined with delta analysis. A sweep with strong opposing delta, meaning price swept highs but delta was heavily negative, is a higher probability reversal signal than a sweep alone.
CVD Divergence Detection
Divergence between price and cumulative delta is one of the most reliable signals the indicator produces. When price is making higher highs but cumulative delta is making lower highs, it suggests that buying pressure is weakening even though price is still rising. This bearish divergence often precedes pullbacks or reversals.
Conversely, bullish divergence occurs when price makes lower lows but cumulative delta makes higher lows. This suggests that even though price is dropping, buying pressure is actually increasing, and sellers may be exhausted. These divergences are calculated over a 5 bar lookback period.
Stacked Imbalance Detection
Stacked imbalances occur when there are three or more consecutive bars with strong delta in the same direction. This represents sustained aggressive positioning by one side of the market. Three consecutive bars with delta above 0.5 suggests aggressive institutional buying. Three consecutive bars below negative 0.5 suggests aggressive institutional selling.
The count of consecutive imbalanced bars is displayed in the detection section. Four or more stacked imbalances is considered highly significant. This pattern often precedes continuation moves in the direction of the imbalance, as it suggests a committed directional player has entered the market.
Institutional Flow Detection
The indicator attempts to identify institutional activity by looking for the convergence of multiple factors. Specifically, it requires strong delta above 0.5 or below negative 0.5, volume persistence across multiple bars meaning above average volume for at least 2 to 3 bars in a row, and delta persistence meaning delta in the same direction for multiple consecutive bars.
When these factors align, the dashboard displays INST BUY or INST SELL instead of RETAIL. This classification should be viewed as a probability estimate rather than a certainty. Retail traders can produce similar patterns, and institutions can hide their activity. The designation is meant to highlight periods where the characteristics of flow are consistent with larger players.
ADAPTIVE WEIGHT SYSTEM
The indicator includes an adaptive system that automatically adjusts how much weight the CVD analysis has on the VWAP calculation. In quiet, low volatility markets, the CVD weight is reduced because the signal to noise ratio is lower. In active, high volatility markets with clear directional flow, the weight is increased.
The adaptation considers multiple factors including VIX regime, delta clarity meaning how strong and consistent the delta readings are, volume persistence, and time of day session weighting. The current adaptive weight is displayed in the dashboard and typically ranges from 0.05 to 0.50.
The adaptation speed setting controls how quickly the weight responds to changing conditions. A higher speed means faster adaptation but potentially more noise. A lower speed means smoother adaptation but potentially slower response to regime changes.
SESSION AWARENESS
Not all trading hours are equal. The indicator applies different weights to different trading sessions based on typical liquidity and reliability patterns. The open drive, which covers 9 30 to 10 30 AM Eastern time, receives a 1.4x weight multiplier because this is typically the highest volume and most directionally significant period of the day.
Power hour from 3 00 to 4 00 PM Eastern receives a 1.3x multiplier as institutional traders often execute their daily positioning in this final hour. The lunch hour from 11 00 AM to 2 00 PM receives a 0.9x multiplier due to typically lower volume and more choppy price action. Premarket receives 0.7x and after hours receives 0.5x due to thin liquidity and unreliable signals.
The current session is displayed in the dashboard header. Traders should consider reducing position sizes and widening stops during lower weight sessions, particularly premarket and after hours where the indicator readings are less reliable.
COMPOSITE SCORES
Bias Score
The Bias Score ranges from negative 100 to positive 100 and represents the indicators overall directional lean. It synthesizes delta analysis, VWAP momentum, and multi-timeframe confluence into a single number. A score above 50 indicates strong bullish bias. A score below negative 50 indicates strong bearish bias. Scores between negative 20 and positive 20 are considered neutral.
The visual bias meter in the dashboard shows this score as a bar that leans left for bearish or right for bullish. This provides an at a glance summary of the indicators current directional reading without needing to interpret multiple individual metrics.
Setup Quality Score
The Setup Quality Score ranges from 0 to 100 and measures how many factors are aligning to support a potential trade. It awards points for strong delta readings, volume persistence, multi-timeframe confluence, detection events like absorption or divergence, and favorable session timing. A score above 60 suggests multiple factors are confirming. A score below 30 suggests the setup lacks confirmation.
This score is designed to help traders filter trades. Rather than acting on every signal, traders can set a minimum quality threshold. For example, only taking trades when quality is above 50 will filter out lower probability setups. Higher thresholds mean fewer trades but potentially higher win rates.
Heat Score
The Heat Score measures overall market activity intensity and ranges from 0 to 100. It combines volume heat meaning how elevated current volume is relative to average, volatility heat based on ATR expansion or VIX levels, delta heat meaning how strong the current delta reading is, and deviation heat meaning how far price is from VWAP.
Markets with heat above 75 are classified as EXTREME and typically represent high opportunity but also high risk environments. Heat between 50 and 75 is ACTIVE and represents good trading conditions. Heat between 25 and 50 is NORMAL. Heat below 25 is QUIET and suggests range bound conditions where mean reversion strategies may outperform trend following.
DASHBOARD GUIDE
Header Row
The header row displays QWAP with a lightning bolt icon, the current session abbreviation like OPEN or POWER or LUNCH, the current regime classification, and VIX status with a colored indicator. Green indicates low VIX and favorable conditions. Yellow indicates elevated VIX. Red indicates high VIX or that VIX data is unavailable.
Signal Row
The signal row is the largest and most prominent element. It displays the primary signal which will be LONG, SHORT, REVERSAL, or WAIT. LONG appears when bias is strongly bullish and quality is high. SHORT appears when bias is strongly bearish and quality is high. REVERSAL appears when divergence or absorption is detected at an extreme sigma level. WAIT appears when conditions do not meet the threshold for a signal.
Next to the signal is the quality score displayed as Q followed by a number out of 100. This helps traders quickly assess how confirmed the signal is. A LONG signal with Q 72 is more compelling than a LONG signal with Q 45.
Order Flow Section
The delta row shows the current delta direction as BUY or SELL, the percentage strength, a visual indicator of strength with filled or empty circles, and an arrow indicating whether delta is accelerating or decelerating. The flow row shows whether activity is classified as INST BUY, INST SELL, or RETAIL, along with the number of intrabar data points used in the calculation.
Market Section
The heat row displays the heat score as a visual bar and numeric value. The vol row shows volatility state as EXPAND, COMPRESS, or NORMAL along with relative volume. The dist row shows distance from VWAP in sigmas and percentage, plus momentum direction.
Detection Section
This section only appears when detections are active. It displays warning icons next to detection types like BUY ABS, SELL ABS, BULL TRAP, BEAR TRAP, BULL DIV, BEAR DIV, BUY STACK, or SELL STACK. Each detection includes a score representing its strength or significance.
HOW TO USE THIS INDICATOR
Recommended Workflow
First, check the regime and session. If VIX is in FEAR mode or you are in premarket or after hours, consider reduced position sizing or waiting for better conditions.
Second, look at the primary signal and quality score. Signals with quality below 40 are low conviction. Consider requiring quality above 50 or 60 before acting.
Third, check the bias meter for overall directional lean. Ensure it aligns with your intended trade direction.
Fourth, review active detections. Absorption and divergence near VWAP bands increase reversal probability. Stacked imbalances support continuation.
Fifth, use VWAP and sigma bands for entry, stop, and target placement. The bands provide natural support and resistance levels based on statistical distribution.
Sixth, monitor for changes in delta and flow classification. Institutional activity transitioning to retail or delta reversing direction are warning signs.
TRADE EXAMPLES
Mean Reversion Setup
Price extended to 2.5 sigma above VWAP. Signal shows REVERSAL. Quality is 55. Absorption detected with BUY ABS showing score of 2.3. Delta is showing SELL at 45 percent despite price being elevated. This suggests buyers are being absorbed and a pullback to VWAP is likely. Enter short with stop above the 3 sigma band and target at VWAP or 1 sigma band.
Trend Continuation Setup
Signal shows LONG with quality 68. Bias meter shows STRONG BULL. BUY STACK detected with 4 consecutive imbalanced bars. Flow shows INST BUY. Price has pulled back to VWAP and is finding support. Heat is at 62 indicating ACTIVE conditions. Enter long on VWAP touch with stop below 1 sigma band and target at 2 sigma band.
Liquidity Sweep Setup
BEAR TRAP detected with score of 1.8. Price swept below recent lows but closed back above. Delta is showing BUY at 52 percent on the sweep bar. BULL DIV also active as price made lower low but delta made higher low. Signal shows REVERSAL with quality 58. Enter long with stop below the sweep low and target at VWAP.
HONEST ASSESSMENT OF STRENGTHS AND WEAKNESSES
Strengths
True CVD calculation using intrabar data is significantly more accurate than close greater than open approximations used by most indicators. This provides genuine insight into buying versus selling pressure.
VIX integration with term structure analysis is institutional grade thinking applied to a retail tool. Dynamic band adjustment prevents false signals in different volatility regimes.
Multiple detection systems provide different perspectives on the same market. Absorption, sweeps, divergence, and imbalances each capture different footprints of institutional activity.
Composite scores synthesize complex information into actionable numbers. Traders do not need to mentally integrate 15 different metrics. The quality score and bias score do this automatically.
Session awareness prevents trading during low quality periods. The automatic weighting helps filter out noise from premarket, after hours, and lunch periods.
Adaptive system self adjusts to market conditions. Traders do not need to manually tune parameters as volatility and activity change.
Weaknesses and Limitations
Intrabar data is still an approximation of true tick level order flow. Without actual tick data showing individual trades hitting bid versus lifting offer, even this calculation has error bars. Professional platforms like Sierra Chart or Quantower with direct exchange feeds will always have more accurate delta.
The indicator is computationally heavy. Users may experience slower chart loading particularly on lower end hardware or when viewing many bars. The optimization features help but cannot eliminate this cost entirely.
Institutional detection is probabilistic not definitive. Retail traders in aggregate can produce patterns that look institutional. Institutions can and do hide their activity. The INST BUY and INST SELL labels should be viewed as probability shifts not certainties.
The indicator works best on liquid instruments with significant volume. On thinly traded stocks or during illiquid periods, delta calculations become noisy and unreliable. The indicator is optimized for ES, NQ, SPY, QQQ, and similar high volume instruments.
VIX integration only works for US equity index products. If trading forex, crypto, or other asset classes, the VIX data is not directly applicable and should be disabled.
No indicator can predict the future. Order flow analysis shows what happened and what is happening. It cannot guarantee what will happen next. Large players can and do reverse their positioning. News events can invalidate any technical setup instantly.
The complexity of the indicator means there is a learning curve. New users may be overwhelmed by the number of metrics displayed. It takes time to develop intuition for what combinations of readings are significant.
The indicator does not include automated backtesting or historical performance statistics. Users cannot easily quantify the win rate or expected value of following its signals without manual journaling and analysis.
RISK MANAGEMENT GUIDELINES
This indicator is a tool not a trading system. It provides information that may help inform trading decisions but it does not make those decisions for you. Proper risk management is essential regardless of how compelling the indicator readings appear.
Position Sizing
Never risk more than 1 to 2 percent of your account on any single trade regardless of how high the quality score is. High quality setups still fail regularly. A setup with 70 percent win rate still loses 30 percent of the time, and those losses can come in clusters.
Consider reducing position size when VIX is in ELEVATED or FEAR regime, when trading during premarket or after hours sessions, when quality score is below 50, and when multiple detection systems are conflicting with each other.
Stop Loss Placement
The sigma bands provide natural levels for stop placement. For mean reversion trades, stops should typically be placed beyond the next sigma level. For example, if entering short at 2 sigma, place stop beyond 3 sigma. For trend trades entering at VWAP, consider stops beyond 1 sigma in the opposite direction.
Stops should also respect market structure. If there is a recent swing high or low near your calculated stop level, extend the stop beyond that swing point. Placing stops at obvious levels invites stop hunting.
In high VIX environments, consider wider stops. The VIX band multiplier automatically widens the sigma bands, and your stops should reflect this increased volatility. A stop that works in a 15 VIX environment may be too tight when VIX is 30.
Taking Profits
The sigma bands also provide natural profit targets. For mean reversion trades, VWAP itself is often the first target with the opposite 1 sigma band as an extended target. For trend trades, each sigma band can serve as a scaling point.
Pay attention to delta and flow changes as price approaches targets. If delta is weakening or flow classification shifts from institutional to retail, consider taking profits early. Conversely, if delta is strengthening into the target, consider holding for extension.
When to Avoid Trading
Consider sitting out when the signal shows WAIT and quality is below 30. In these conditions, the indicator is essentially saying there is no clear edge. Trading anyway is gambling not trading.
Avoid trading during major news events. The indicator cannot account for sudden information shocks. Economic releases, Fed announcements, earnings reports, and geopolitical events can invalidate any technical setup instantly.
Consider avoiding the first and last 5 minutes of regular trading hours. These periods often have erratic price action and unreliable delta calculations due to order imbalances at open and close.
SETTINGS REFERENCE
Core Engine Settings
VWAP Source determines what price is used for the VWAP calculation. The default HLC3 uses the average of high, low, and close which provides a balanced representation. HL2 uses just high and low average. Close uses only the closing price. Most traders should leave this at HLC3.
True CVD Engine should remain enabled for accurate order flow analysis. Disabling it falls back to close greater than open estimation which is significantly less accurate. Only disable if you are experiencing performance issues.
CVD Impact controls how much the delta analysis affects the VWAP calculation. Higher values mean delta has more influence. The default 0.2 provides a balance. Increase toward 0.5 if you want delta to have stronger effect. Decrease toward 0.1 if you want something closer to traditional VWAP.
Detection Sensitivity offers three presets. Conservative produces fewer signals but higher confidence. Balanced is the default middle ground. Aggressive produces more signals but with more false positives. New users should start with Balanced and adjust based on experience.
VIX Settings
VIX Integration should be enabled when trading US equity index products like ES, NQ, SPY, or QQQ. Disable it when trading forex, crypto, commodities, or individual stocks where VIX is not directly applicable.
VIX Symbol allows selection between VIX for SP500 volatility, VXN for Nasdaq volatility, and RVX for Russell 2000 volatility. Choose the one most relevant to your trading instrument.
VIX Baseline sets the historical average VIX level used for normalization. The default 16 represents the long term average. If trading in a persistently higher or lower VIX environment, adjusting this can help calibrate the regime classifications.
Display Settings
Dashboard Style offers three options. Compact shows only the signal and bias meter for minimal screen footprint. Elite adds order flow and market sections for balanced information. Full adds VIX details, detections, and adaptive system information for complete visibility.
FREQUENTLY ASKED QUESTIONS
Why does the indicator sometimes show WAIT when there is an obvious trend
The signal system is designed to identify high probability entry points not to constantly indicate trend direction. A strong uptrend may show WAIT because price is extended from VWAP and a pullback is likely before continuation. The indicator is trying to prevent you from buying the top of an impulse move.
Why is my delta reading different from another order flow tool
Different platforms calculate delta differently. Some use tick data. Some use time based aggregation. Some use volume based aggregation. The timeframe being analyzed matters as well. QWAP uses intrabar data which is more accurate than close versus open approximations but less accurate than true tick data from professional platforms.
Can I use this indicator for scalping
The indicator can be used on lower timeframes but becomes less reliable. On 1 minute charts, the intrabar decomposition has fewer data points to work with. For scalping, consider using 3 to 5 minute charts as a minimum. Also note that the session weighting and detection systems are calibrated for swing and intraday trading, not ultra short term scalping.
Does this indicator repaint
The VWAP line and sigma bands can adjust slightly as intrabar data comes in during a live bar. Once a bar closes, those values are fixed. The signals and detections are calculated on closed bars and do not repaint. For live trading, wait for bar close confirmation before acting on signals.
What markets does this work best on
The indicator is optimized for high liquidity US equity index products including ES, NQ, SPY, QQQ, IWM, and DIA. It can work on other liquid instruments but the VIX integration should be disabled for non equity products. Avoid using on low volume stocks or illiquid markets where delta calculations will be noisy.
DISCLAIMER
This indicator is provided for educational and informational purposes only. It is not financial advice. Past performance of any trading methodology is not indicative of future results. Trading futures, options, and other derivatives involves substantial risk of loss and is not suitable for all investors.
The creator of this indicator makes no guarantees about its accuracy or profitability. All trading decisions are the sole responsibility of the user. Before trading with real money, thoroughly test any strategy in simulation and ensure you understand the risks involved.
Order flow analysis provides information about market microstructure but cannot predict future price movements with certainty. Markets are complex adaptive systems influenced by countless variables including news events, economic data, central bank policy, geopolitical developments, and collective human psychology. No indicator can fully capture this complexity.
Use this tool as one input among many in your trading process. Combine it with sound risk management, proper position sizing, and continuous education. The best traders are those who remain humble about what they do not know and disciplined about protecting their capital.
保護スクリプト
このスクリプトのソースコードは非公開で投稿されています。 ただし、制限なく自由に使用できます – 詳細はこちらでご確認ください。
Risk Management > Everything else
免責事項
この情報および投稿は、TradingViewが提供または推奨する金融、投資、トレード、その他のアドバイスや推奨を意図するものではなく、それらを構成するものでもありません。詳細は利用規約をご覧ください。
保護スクリプト
このスクリプトのソースコードは非公開で投稿されています。 ただし、制限なく自由に使用できます – 詳細はこちらでご確認ください。
Risk Management > Everything else
免責事項
この情報および投稿は、TradingViewが提供または推奨する金融、投資、トレード、その他のアドバイスや推奨を意図するものではなく、それらを構成するものでもありません。詳細は利用規約をご覧ください。