PROTECTED SOURCE SCRIPT
Smart Money OB + Limit Orders + Priority
Detects breaks of structure (BOS) using swing highs/lows and an ATR-filtered impulse bar.
Builds simple order-block based levels and plots theoretical limit orders:
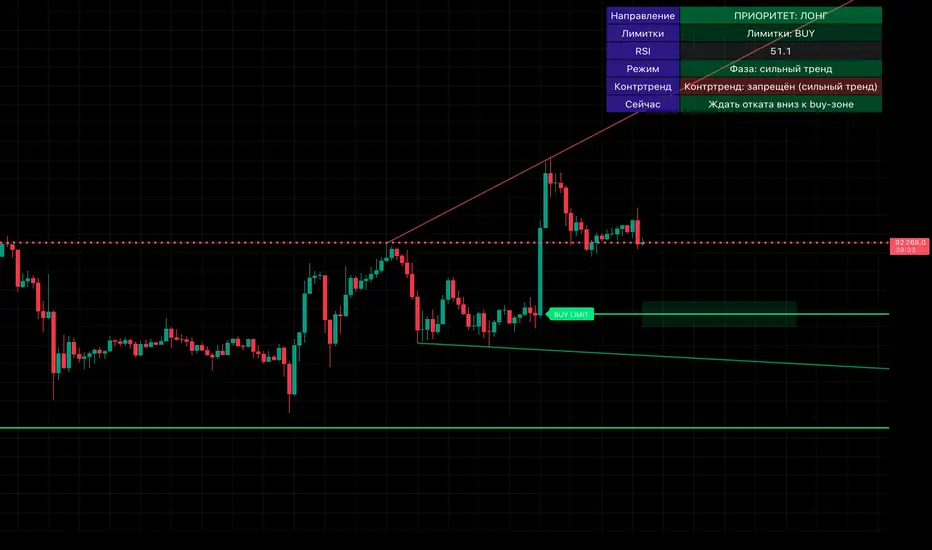
Buy limits are always placed below current price.
Sell limits are always placed above current price.
Shows a higher-timeframe bias using EMAs on two selectable timeframes (for example H4 + H1).
Draws “HTF-style” trendlines on the current timeframe using wider swing points.
Calculates RSI and highlights overbought/oversold regions for context.
Draws an optional “accumulation zone” box around the nearest limit level.
Optional counter-trend status: when trend is not extremely strong and price/RSI are stretched, the script can visually suggest a possible counter-trend move towards the zone (dotted arrow).
Info panel in the top-right corner summarises:
Direction priority (long / short / none)
Limit side (BUY / SELL / none)
RSI value
Trend regime (no trend / weak / strong)
Counter-trend status
“Now” line – a short text description of the current situation.
Usage notes
This script is designed to make chart reading easier: it organises structure, bias and potential areas on the chart, so you can build your own trading plans.
It does not guarantee results and should not be considered financial advice.
Always confirm ideas with your own analysis and risk management before taking any trades.
Builds simple order-block based levels and plots theoretical limit orders:
Buy limits are always placed below current price.
Sell limits are always placed above current price.
Shows a higher-timeframe bias using EMAs on two selectable timeframes (for example H4 + H1).
Draws “HTF-style” trendlines on the current timeframe using wider swing points.
Calculates RSI and highlights overbought/oversold regions for context.
Draws an optional “accumulation zone” box around the nearest limit level.
Optional counter-trend status: when trend is not extremely strong and price/RSI are stretched, the script can visually suggest a possible counter-trend move towards the zone (dotted arrow).
Info panel in the top-right corner summarises:
Direction priority (long / short / none)
Limit side (BUY / SELL / none)
RSI value
Trend regime (no trend / weak / strong)
Counter-trend status
“Now” line – a short text description of the current situation.
Usage notes
This script is designed to make chart reading easier: it organises structure, bias and potential areas on the chart, so you can build your own trading plans.
It does not guarantee results and should not be considered financial advice.
Always confirm ideas with your own analysis and risk management before taking any trades.
保護スクリプト
このスクリプトのソースコードは非公開で投稿されています。 ただし、制限なく自由に使用できます – 詳細はこちらでご確認ください。
免責事項
この情報および投稿は、TradingViewが提供または推奨する金融、投資、トレード、その他のアドバイスや推奨を意図するものではなく、それらを構成するものでもありません。詳細は利用規約をご覧ください。
保護スクリプト
このスクリプトのソースコードは非公開で投稿されています。 ただし、制限なく自由に使用できます – 詳細はこちらでご確認ください。
免責事項
この情報および投稿は、TradingViewが提供または推奨する金融、投資、トレード、その他のアドバイスや推奨を意図するものではなく、それらを構成するものでもありません。詳細は利用規約をご覧ください。