INVITE-ONLY SCRIPT
Multi Time Frame MTF Correlation Coefficient meter
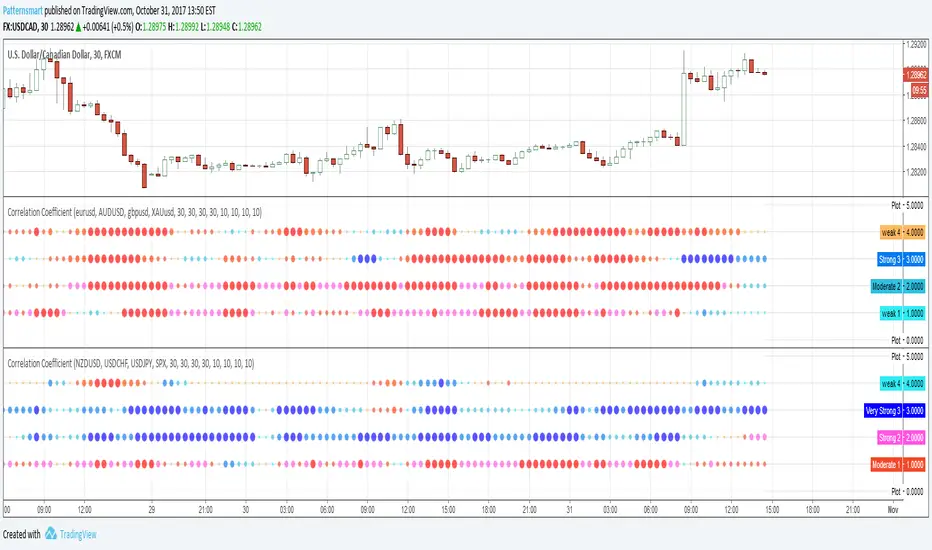
This indicator shows the Correlation Coefficient between the four input symbols and current chart symbol over the corresponding timeframe and period inputs.
You can input four symbols with different aggregation and period settings.
The period input is the number of bars used to calculate the correlation coefficient.
How to Read the Correlation Coefficient indicator
Each dot shows the correlation coefficient between the two symbols over the corresponding timeframe and period inputs. The following categories indicate a quick way of interpreting the table values. Note that a negative correlation means the two currency pairs correlate in the opposite directions (e.g. when the price for one goes up, the other one goes down and vice versa)
Positive 0.0 to 0.25 weak correlation, shown as small cyan dot.
Positive 0.25 to 0.5 Moderate correlation, shown as medium light blue dot.
Positive 0.5 to 0.75 Strong correlation, shown as big light blue dot.
Positive 0.75 to 1.0 Very strong correlation, shown as large blue dot.
Negative 0.0 to 0.25 weak correlation, shown as small orange dot.
Negative 0.25 to 0.5 Moderate correlation, shown as medium orange dot.
Negative 0.5 to 0.75 Strong correlation, shown as big purple dot.
Negative 0.75 to 1.0 Very strong correlation, shown as large red dot.
You can also change the plot style to meet your needs.
招待専用スクリプト
このスクリプトは作者が承認したユーザーのみアクセス可能です。使用するにはアクセス申請をして許可を得る必要があります。通常は支払い後に承認されます。詳細は下記の作者の指示に従うか、Patternsmartに直接お問い合わせください。
TradingViewは、作者を完全に信頼し、スクリプトの動作を理解していない限り、有料スクリプトの購入・使用を推奨しません。コミュニティスクリプトには無料のオープンソースの代替が多数あります。
作者の指示
免責事項
この情報および投稿は、TradingViewが提供または推奨する金融、投資、トレード、その他のアドバイスや推奨を意図するものではなく、それらを構成するものでもありません。詳細は利用規約をご覧ください。