OPEN-SOURCE SCRIPT
更新済 MTF Ichimoku Cloud
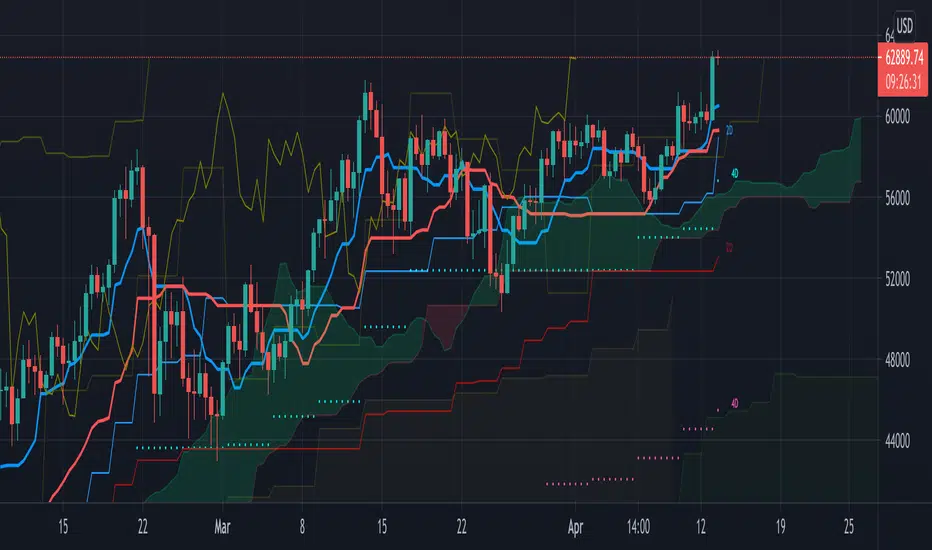
Here is my take on Ichimoku Cloud, Multiple Time Frames, based on the
most excellent work of "PineCoders" (MTF Selection Framework functions)!
The big advantage is that on 1 image you can easily see where
price is compared to Ichimoku Cloud patterns (each of different Time Frames).
This gives a lot of Support and Resistance area's!
I restricted the amount of MTF's at 2, more is just too messy
To make it more clear:
- Conversion line and Baseline in present timeframe : thick line
- Conversion line and Baseline in Higher Time Frame (HTF 1) : thin line
- Conversion line and Baseline in Higher Time Frame (HTF 2) : line with circles
All lines has labels at the right of the line with corresponding Time Frame


Since some prefer different settings with higher Time Frames,
each period in each Time Frame can be changed
The Time Frames itself can be chosen:
- or a multiple of present Time Frame
- or a fixed chosen Time Frame
Thanks!
most excellent work of "PineCoders" (MTF Selection Framework functions)!
The big advantage is that on 1 image you can easily see where
price is compared to Ichimoku Cloud patterns (each of different Time Frames).
This gives a lot of Support and Resistance area's!
I restricted the amount of MTF's at 2, more is just too messy
To make it more clear:
- Conversion line and Baseline in present timeframe : thick line
- Conversion line and Baseline in Higher Time Frame (HTF 1) : thin line
- Conversion line and Baseline in Higher Time Frame (HTF 2) : line with circles
All lines has labels at the right of the line with corresponding Time Frame
Since some prefer different settings with higher Time Frames,
each period in each Time Frame can be changed
The Time Frames itself can be chosen:
- or a multiple of present Time Frame
- or a fixed chosen Time Frame
Thanks!
リリースノート
Just some tweakingIt is important to mention that it works alone with continue charts,
I mean like crypto, where trading happens non-stop.
Stock, Futures, ... where trading stops in the day and weekends doesn't mix with this script, sorry...
リリースノート
Fixed the issue regarding stock, Futures, ... Normally MTF Ichimoku Cloud will perform as intended
Thanks!
リリースノート
small fixesリリースノート
updateリリースノート
Small fixesリリースノート
Small adjustments for overlappingリリースノート
Deleted 2 labels since the scripts doesn't work anymore (it used to work though...)オープンソーススクリプト
TradingViewの精神に則り、このスクリプトの作者はコードをオープンソースとして公開してくれました。トレーダーが内容を確認・検証できるようにという配慮です。作者に拍手を送りましょう!無料で利用できますが、コードの再公開はハウスルールに従う必要があります。
Who are PineCoders?
tradingview.com/chart/SSP/yW5eOqtm-Who-are-PineCoders/
TG Pine Script® Q&A: t.me/PineCodersQA
- We cannot control our emotions,
but we can control our keyboard -
tradingview.com/chart/SSP/yW5eOqtm-Who-are-PineCoders/
TG Pine Script® Q&A: t.me/PineCodersQA
- We cannot control our emotions,
but we can control our keyboard -
免責事項
この情報および投稿は、TradingViewが提供または推奨する金融、投資、トレード、その他のアドバイスや推奨を意図するものではなく、それらを構成するものでもありません。詳細は利用規約をご覧ください。
オープンソーススクリプト
TradingViewの精神に則り、このスクリプトの作者はコードをオープンソースとして公開してくれました。トレーダーが内容を確認・検証できるようにという配慮です。作者に拍手を送りましょう!無料で利用できますが、コードの再公開はハウスルールに従う必要があります。
Who are PineCoders?
tradingview.com/chart/SSP/yW5eOqtm-Who-are-PineCoders/
TG Pine Script® Q&A: t.me/PineCodersQA
- We cannot control our emotions,
but we can control our keyboard -
tradingview.com/chart/SSP/yW5eOqtm-Who-are-PineCoders/
TG Pine Script® Q&A: t.me/PineCodersQA
- We cannot control our emotions,
but we can control our keyboard -
免責事項
この情報および投稿は、TradingViewが提供または推奨する金融、投資、トレード、その他のアドバイスや推奨を意図するものではなく、それらを構成するものでもありません。詳細は利用規約をご覧ください。