PROTECTED SOURCE SCRIPT
Yield curve indicator trial
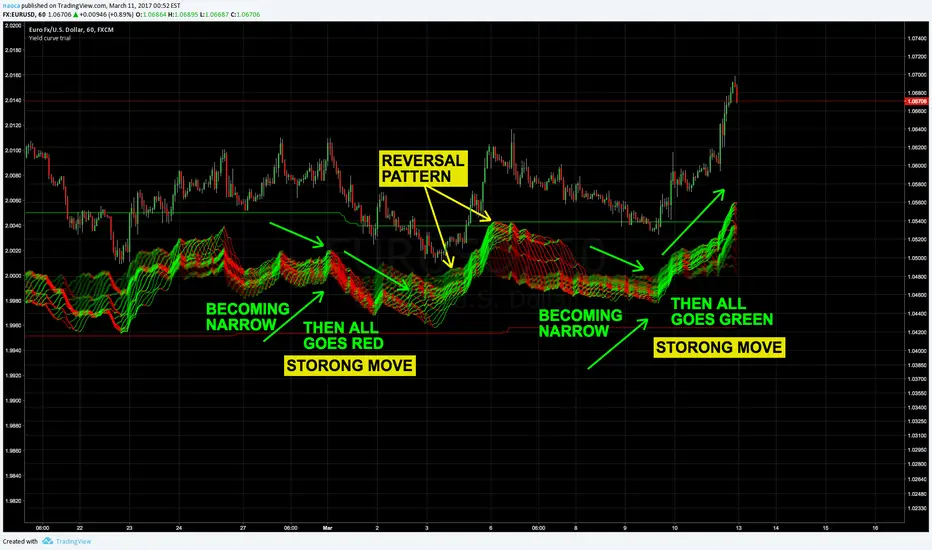
This indicator shows the multiple time frame yield curves of chart.
It’s useful to understand how much good or bad is the performance for short-term & long-term traders.
Near side of lines indicates longer term yield.
And far side of lines indicates shorter term of yield.
While it’s ascending, its color is green & if not it will be red.
- - - - - - - - - - - - - - - - - - - - - - - - - - - - - -
This is trial version. You can check how it works on any chart!
* Data before March. 17th, 2017 can be shown.
More information:
tradeindicator.tumblr.com/post/158257399947/yield-curve-indicator
tradeindicator.tumblr.com/
保護スクリプト
このスクリプトのソースコードは非公開で投稿されています。 However, you can use it freely and without any limitations – learn more here.
免責事項
The information and publications are not meant to be, and do not constitute, financial, investment, trading, or other types of advice or recommendations supplied or endorsed by TradingView. Read more in the Terms of Use.