INVITE-ONLY SCRIPT
[SignalFI] DynaPIV Trend
Welcome!
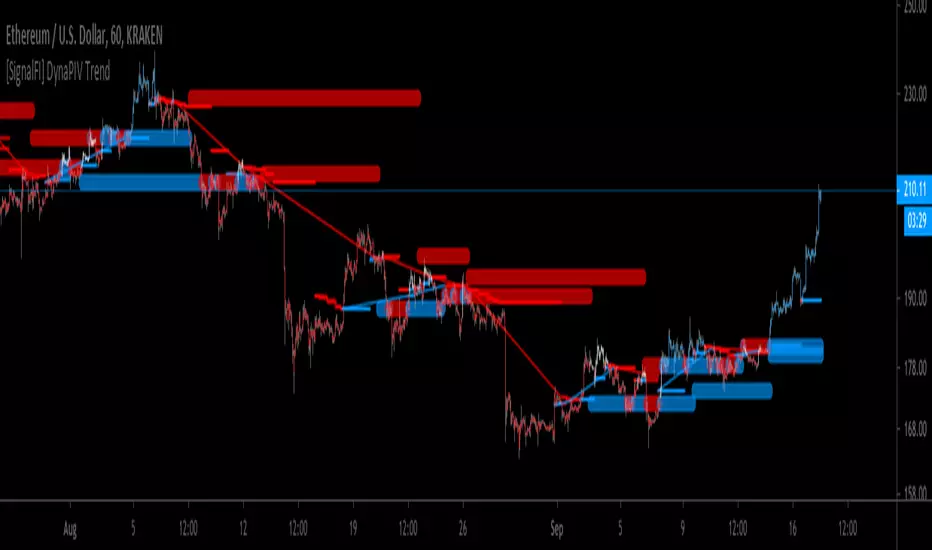
We're pleased to introduce DynaPIV Trend! This single script provides a array of valuable trend information that can help in short term scalping strategies, and helping define trend strength across support and resistance points.
The heart of DynaPIV is an dynamic, volatility adjusted moving average based on fibonacci ratios. The script creates a visual representation of trend based on the pivots created with this dynamic moving average as has both short and long term support and resistance lines delineated by color and thickness.
In general, the script will color bars according to the trend. By default, our safe mode is enabled which will filter out potential false breakouts, as well identify channeling zones (where bars are white). Disabling Safe Mode will provide more opportunities for scalping, however increases the risk of trend invalidation. By nature the trader is meant to follow the comprehensive visual presented by DynaPIV Trend, inclusive of horizontal and diagonal painted support and resistance lines.
NOTE: The script is useful for timeframes 5M to 2HR. However the recommended is 30M - 1HR. Using the script on higher timeframes will invalidate the dynamic nature of the DynaPIV Trend volatility calculation and thus render the trend invalid.
SignalFI was created to help traders and investors to effectively analyze the market based on the Golden Mean Ratio (Fibonacci numbers), plan a trade and ultimately execute it. To help inform and educate market decisions we developed a set of Trading Indicators which are available on TradingView.
SignalFI indicators are just that, indicators. Our indicators are generally configured to use completely historical data (negating repaint), and we advise all alerts created with SignalFI indicators to be fired upon "close" of the current candle. Our indicators can provide valuable context and visualization support when performing market analysis and executing buy and sell decisions. However. we are not financial experts, and all information presented on this site or our other media outlets are for educational purposes only.
For subscription information, visit signalfi.net and follow us on twitter: @signalfi_
招待専用スクリプト
このスクリプトは作者が承認したユーザーのみアクセス可能です。使用するにはアクセス申請をして許可を得る必要があります。通常は支払い後に承認されます。詳細は下記の作者の指示に従うか、SignalFiに直接お問い合わせください。
TradingViewは、作者を完全に信頼し、スクリプトの動作を理解していない限り、有料スクリプトの購入・使用を推奨しません。コミュニティスクリプトには無料のオープンソースの代替が多数あります。
作者の指示
SignalFi is creating cutting edge TradingView scripts to help identify rogue market Alpha. Check out signalfi.net for subscription information and @signalfi_ on Twitter for updates.
免責事項
この情報および投稿は、TradingViewが提供または推奨する金融、投資、トレード、その他のアドバイスや推奨を意図するものではなく、それらを構成するものでもありません。詳細は利用規約をご覧ください。