OPEN-SOURCE SCRIPT
Cumulative TICK [Pt]

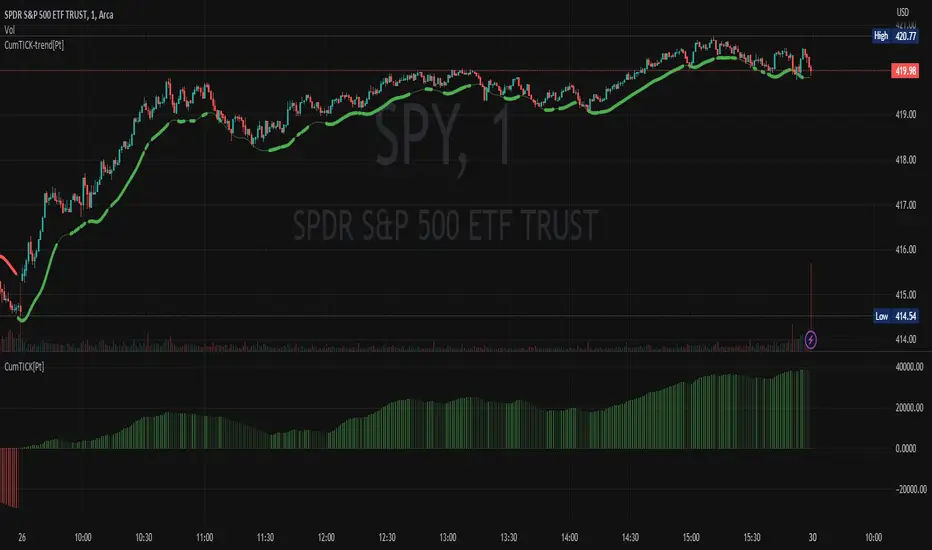
Cumulative TICK Indicator, shown as the bottom indicator, is a robust tool designed to provide traders with insights into market trends using TICK data. This indicator visualizes the cumulative TICK trend in the form of colored columns on a separate chart below the main price chart.
Here's an overview of the key features of the Cumulative TICK Indicator:
1. Selectable TICK Source 🔄: The indicator allows users to choose from four different TICK data sources, namely TICK,
TICK,  TICKQ,
  TICKI, and $USI:TICKA.
2. TICK Data Type Selection 🎚️: Users can select the type of TICK data to be used. The options include: Close, Open, hl2, ohlc4, hlc3.
3. Optional Simple Moving Average (SMA) 📊: The indicator offers an option to apply an SMA to the Cumulative TICK values, with a customizable length.
4. After-hour Background Color 🌙: The background color changes during after-hours to provide a clear distinction between regular and after-hour trading sessions.
🛠️ How it Works:
The Cumulative TICK Indicator uses TICK data accumulated during the regular market hours (9:30-16:00) as per the New York time zone. At the start of a new session or at the end of the regular session, this cumulative TICK value is reset.
The calculated Cumulative TICK is plotted in a column-style graph. If the SMA is applied, the SMA values are used for the column plots instead. The columns are colored green when the Cumulative TICK is positive and red when it is negative. The shades of green and red vary based on whether the Cumulative TICK is increasing or decreasing compared to the previous value.
This is a simple yet powerful tool to track market sentiment throughout the day using TICK data. Please note that this indicator is intended to be used as part of a comprehensive trading strategy. Always ensure you are managing risk appropriately and consulting various data sources to make informed trading decisions.
Here's an overview of the key features of the Cumulative TICK Indicator:
1. Selectable TICK Source 🔄: The indicator allows users to choose from four different TICK data sources, namely
2. TICK Data Type Selection 🎚️: Users can select the type of TICK data to be used. The options include: Close, Open, hl2, ohlc4, hlc3.
3. Optional Simple Moving Average (SMA) 📊: The indicator offers an option to apply an SMA to the Cumulative TICK values, with a customizable length.
4. After-hour Background Color 🌙: The background color changes during after-hours to provide a clear distinction between regular and after-hour trading sessions.
🛠️ How it Works:
The Cumulative TICK Indicator uses TICK data accumulated during the regular market hours (9:30-16:00) as per the New York time zone. At the start of a new session or at the end of the regular session, this cumulative TICK value is reset.
The calculated Cumulative TICK is plotted in a column-style graph. If the SMA is applied, the SMA values are used for the column plots instead. The columns are colored green when the Cumulative TICK is positive and red when it is negative. The shades of green and red vary based on whether the Cumulative TICK is increasing or decreasing compared to the previous value.
This is a simple yet powerful tool to track market sentiment throughout the day using TICK data. Please note that this indicator is intended to be used as part of a comprehensive trading strategy. Always ensure you are managing risk appropriately and consulting various data sources to make informed trading decisions.
オープンソーススクリプト
TradingViewの精神に則り、このスクリプトの作者はコードをオープンソースとして公開してくれました。トレーダーが内容を確認・検証できるようにという配慮です。作者に拍手を送りましょう!無料で利用できますが、コードの再公開はハウスルールに従う必要があります。
Purchases / Subscriptions / Support - buymeacoffee.com/ptgambler
PayPal - paypal.me/PtGambler
You can reach me privately through my Discord Channel: discord.gg/WMQfaVGyQC
PayPal - paypal.me/PtGambler
You can reach me privately through my Discord Channel: discord.gg/WMQfaVGyQC
免責事項
この情報および投稿は、TradingViewが提供または推奨する金融、投資、トレード、その他のアドバイスや推奨を意図するものではなく、それらを構成するものでもありません。詳細は利用規約をご覧ください。