OPEN-SOURCE SCRIPT
Absolute Momentum Indicator
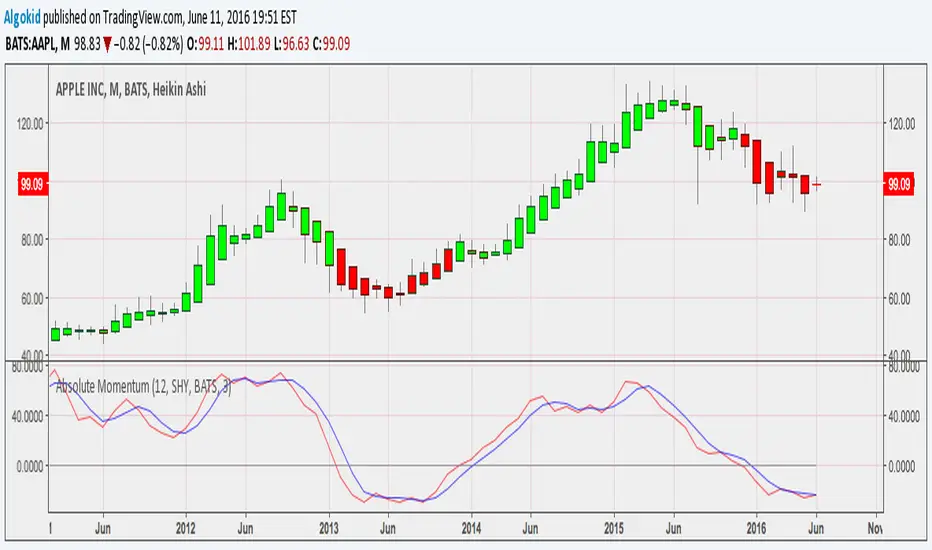
Covered intensevely by Gary Antonnacci in his paper " Absolute Momentum : A simple Rule Based Strategy and Universal Trend Following Overlay , Absolute momentum buys asset with excess return, which is calculated by taking the return of the asset for a giving period of time LESS the Treasury bill rate . The following indicator is based on the rules found in the paper. However you have the liberty to choose your time frame and symbol to calculate the excess return .
Read more about this indicator here
Cheers
Read more about this indicator here
Cheers
オープンソーススクリプト
TradingViewの精神に則り、このスクリプトの作者はコードをオープンソースとして公開してくれました。トレーダーが内容を確認・検証できるようにという配慮です。作者に拍手を送りましょう!無料で利用できますが、コードの再公開はハウスルールに従う必要があります。
免責事項
この情報および投稿は、TradingViewが提供または推奨する金融、投資、トレード、その他のアドバイスや推奨を意図するものではなく、それらを構成するものでもありません。詳細は利用規約をご覧ください。
オープンソーススクリプト
TradingViewの精神に則り、このスクリプトの作者はコードをオープンソースとして公開してくれました。トレーダーが内容を確認・検証できるようにという配慮です。作者に拍手を送りましょう!無料で利用できますが、コードの再公開はハウスルールに従う必要があります。
免責事項
この情報および投稿は、TradingViewが提供または推奨する金融、投資、トレード、その他のアドバイスや推奨を意図するものではなく、それらを構成するものでもありません。詳細は利用規約をご覧ください。