PROTECTED SOURCE SCRIPT
更新済 Index Volume
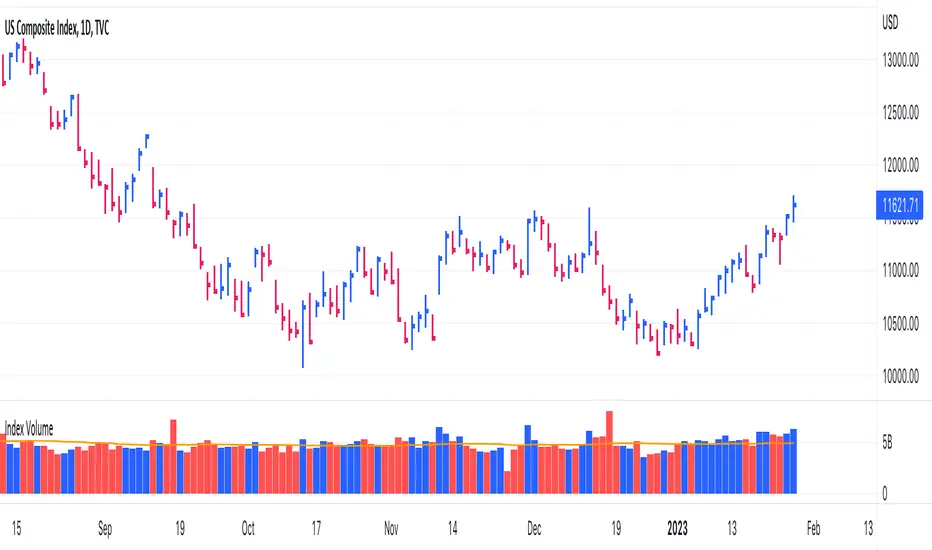
This indicator displays the volume for the Nasdaq Composite and S&P500 indexes just like any other stock. Also displays any normal stock volume as well. Customizations include choice of colors and moving average length.
リリースノート
New option to automatically plot a diamond on follow through and distribution days. Also have the ability to show distribution clusters. (4 distribution days in a rolling 8 day window) リリースノート
Cleaned up the status line display to only show Volume and Volume Averageリリースノート
Added ability for volatility adjusted follow through days, as defined in IBD's Market School. - Volatility defined as the average percentage gain of the up days over the prior 200 days.
- Volatility less than or equal to 0.4%, follow-through must close up 0.7% or higher.
- Volatility greater than or equal to 0.4% and less than 0.55%, follow-through must close up 0.85% or higher.
- Volatility greater than or equal to 0.55% and less than 1.00%, follow-through must close up 1.00% or higher.
- Volatility greater than or equal to 1.00%, follow-through must close up 1.245% or higher.
リリースノート
Updated volume source for the indexes, should update in real time now. リリースノート
Update shows volume run rate on stocks. 保護スクリプト
このスクリプトのソースコードは非公開で投稿されています。 ただし、制限なく自由に使用できます – 詳細はこちらでご確認ください。
Trusted Pine programmer. Send me a message for script development.
免責事項
この情報および投稿は、TradingViewが提供または推奨する金融、投資、トレード、その他のアドバイスや推奨を意図するものではなく、それらを構成するものでもありません。詳細は利用規約をご覧ください。
保護スクリプト
このスクリプトのソースコードは非公開で投稿されています。 ただし、制限なく自由に使用できます – 詳細はこちらでご確認ください。
Trusted Pine programmer. Send me a message for script development.
免責事項
この情報および投稿は、TradingViewが提供または推奨する金融、投資、トレード、その他のアドバイスや推奨を意図するものではなく、それらを構成するものでもありません。詳細は利用規約をご覧ください。