INVITE-ONLY SCRIPT
更新済 MVEX VOLA MODEL
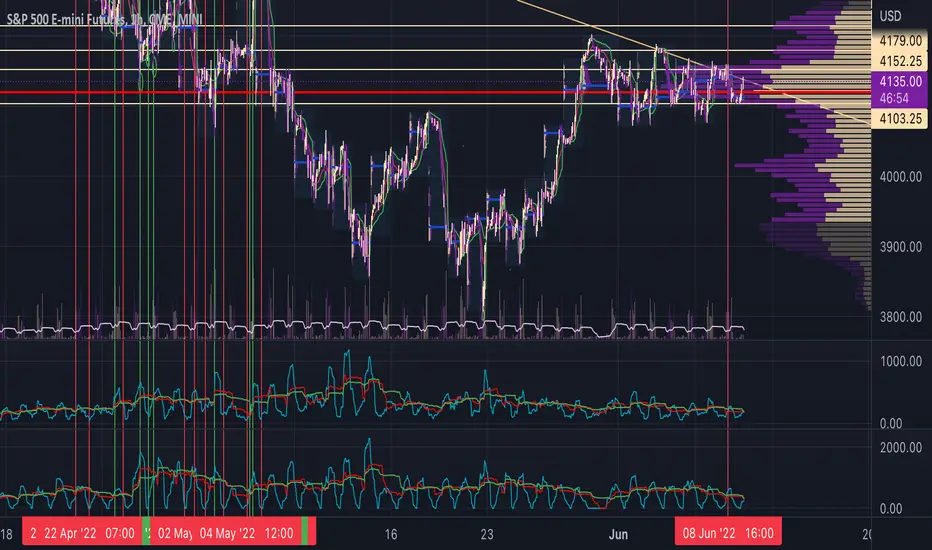
To use this script which focusses on vol on the given equity/commodity/price pair its focussed on at its core methodology. We use ES1 here as an example on how this indicator can be used. This indicator is mainly for ES/NQ and its constituents (except consumer staples, energy etc) which lack the same correlations.
Note the red lines indicate where buy signals occurred an example listed below. Note the best timeframes to use this indicator include (intraday - 1d trades) 30min, 1hr and Daily for multi day trades.
This is distilled into a simple method where you can use this indicator to gauge a potential buy or sell signal. The red shows a sell signal and a green which is a buy i.e. when the blue line short term signal (blue line) has a major divergence vs the mid and long term then this is typically a sell signal. This is shown in the chart above.
The green lines indicate where buy signals occurred with an example listed below.
The same goes for the reverse where the short term signal (blue line) is higher then we have a view of a potential buy signal.
Once again when the VVS (Short term signal) is flattened out then we have a slowing done in the movement of price action and a reversion has the potential to occur.
Once again there are times where the signal will not work, as with every indicator, model etc nothing hits 100% and I doubt there ever will be such an indicator to exist. As with everything please manage your risk.
リリースノート
Minor tweaks招待専用スクリプト
このスクリプトは作者が承認したユーザーのみアクセス可能です。使用するにはアクセス申請をして許可を得る必要があります。通常は支払い後に承認されます。詳細は下記の作者の指示に従うか、vexxlyに直接お問い合わせください。
TradingViewは、作者を完全に信頼し、スクリプトの動作を理解していない限り、有料スクリプトの購入・使用を推奨しません。コミュニティスクリプトには無料のオープンソースの代替が多数あります。
作者の指示
Feel free to reach out
免責事項
この情報および投稿は、TradingViewが提供または推奨する金融、投資、トレード、その他のアドバイスや推奨を意図するものではなく、それらを構成するものでもありません。詳細は利用規約をご覧ください。
招待専用スクリプト
このスクリプトは作者が承認したユーザーのみアクセス可能です。使用するにはアクセス申請をして許可を得る必要があります。通常は支払い後に承認されます。詳細は下記の作者の指示に従うか、vexxlyに直接お問い合わせください。
TradingViewは、作者を完全に信頼し、スクリプトの動作を理解していない限り、有料スクリプトの購入・使用を推奨しません。コミュニティスクリプトには無料のオープンソースの代替が多数あります。
作者の指示
Feel free to reach out
免責事項
この情報および投稿は、TradingViewが提供または推奨する金融、投資、トレード、その他のアドバイスや推奨を意図するものではなく、それらを構成するものでもありません。詳細は利用規約をご覧ください。