INVITE-ONLY SCRIPT
BLITZ PE ANAYLYZER
Following script is designed specifically to meet the requirement of accessing the PE ratio, comparing it to it's historical averages, median and expected values that are possible.
Following is the method to use the indicator:
1) User must select the look back years which is by default set to 3 years as per the text book reference from the book "The Intelligent Investor" by Sir Benjamin Graham
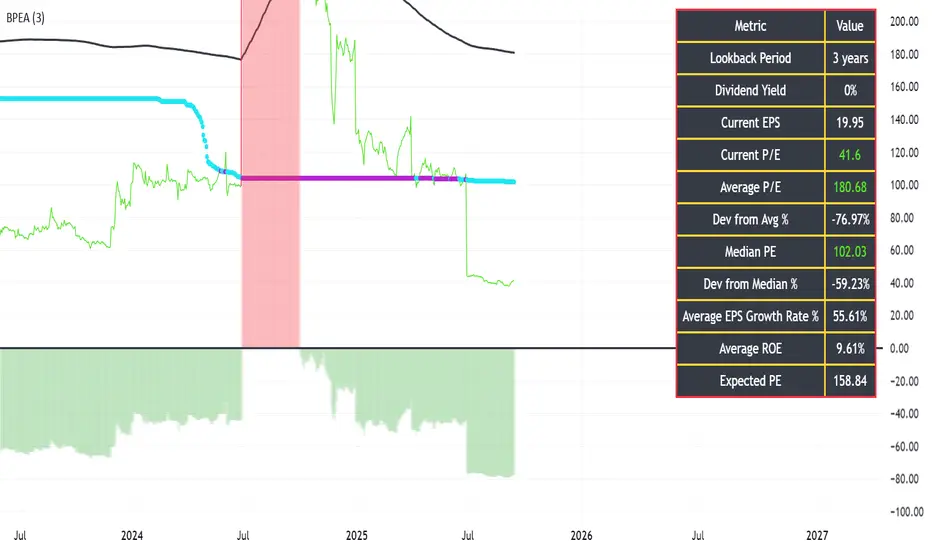
2) The red or green histogram represents the deviation of the current PE to the average PE. If the histograms are green in color, it represent buy opportunity because the current PE is lower than that of the average PE values, the % deviation of the current PE from the average value is mentioned in the black color table and a negative value represents under evaluations as compared to the historical PE ratio
3) The black color line is the SMA of the PE ratio.
4) Another plots exists for plotting the current PE which is red or green depending upon its deviation from the average PE values & another plot exists for median PE ratio which is light blue when healthy and purple when not healthy.
5) Using the inflation data and the EPS growth of the company the black table also displays the expected value of the PE ratio for the stock.
Following is the method to use the indicator:
1) User must select the look back years which is by default set to 3 years as per the text book reference from the book "The Intelligent Investor" by Sir Benjamin Graham
2) The red or green histogram represents the deviation of the current PE to the average PE. If the histograms are green in color, it represent buy opportunity because the current PE is lower than that of the average PE values, the % deviation of the current PE from the average value is mentioned in the black color table and a negative value represents under evaluations as compared to the historical PE ratio
3) The black color line is the SMA of the PE ratio.
4) Another plots exists for plotting the current PE which is red or green depending upon its deviation from the average PE values & another plot exists for median PE ratio which is light blue when healthy and purple when not healthy.
5) Using the inflation data and the EPS growth of the company the black table also displays the expected value of the PE ratio for the stock.
招待専用スクリプト
こちらのスクリプトにアクセスできるのは投稿者が承認したユーザーだけです。投稿者にリクエストして使用許可を得る必要があります。通常の場合、支払い後に許可されます。詳細については、以下、作者の指示をお読みになるか、Noob1003に直接ご連絡ください。
スクリプトの機能を理解し、その作者を全面的に信頼しているのでなければ、お金を支払ってまでそのスクリプトを利用することをTradingViewとしては「非推奨」としています。コミュニティスクリプトの中で、その代わりとなる無料かつオープンソースのスクリプトを見つけられる可能性もあります。
作者の指示
This is a paid indicator, useful for all who are into portfolio management & stock picking.
Fees to get the paid subscription of this stock is mere $100/- for lifetime usage.
Payments are accepted in cash, bank transfer, upi, paypal, crypto
免責事項
これらの情報および投稿は、TradingViewが提供または保証する金融、投資、取引、またはその他の種類のアドバイスや推奨を意図したものではなく、またそのようなものでもありません。詳しくは利用規約をご覧ください。