PROTECTED SOURCE SCRIPT
OCM Logarithmic Deviation Torch
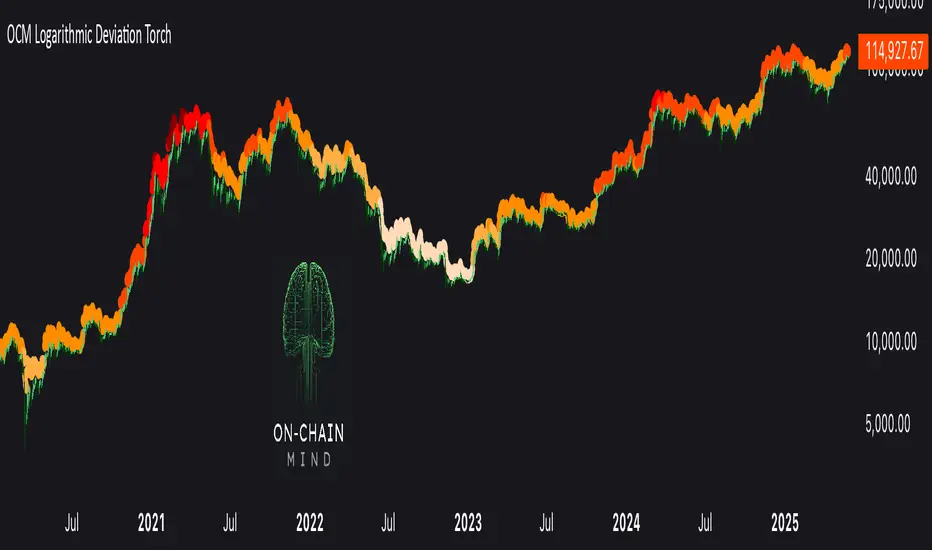
OCM Logarithmic Deviation Torch
The Logarithmic Deviation Torch is a dynamic risk signalling overlay that transforms daily logarithmic price divergence into a normalized probabilistic gauge. By anchoring its logic to long-term trend baselines and structurally adjusting for time via a custom power-scaling method, it identifies asymmetrical extremes in market positioning with visual clarity.
Coloured dots are plotted above price action in real time, representing a graduated risk scale that evolves alongside underlying volatility. This tool is ideal for traders seeking a forward-biased perspective on overextension or compression within a logarithmic return environment — without relying on reactivity or lag-prone indicators.
⏰ Timeframes to be used on:
Daily
Weekly
保護スクリプト
このスクリプトのソースコードは非公開で投稿されています。 しかし、無料かつ制限なしでご利用いただけます ― 詳細についてはこちらをご覧ください。
免責事項
これらの情報および投稿は、TradingViewが提供または保証する金融、投資、取引、またはその他の種類のアドバイスや推奨を意図したものではなく、またそのようなものでもありません。詳しくは利用規約をご覧ください。
保護スクリプト
このスクリプトのソースコードは非公開で投稿されています。 しかし、無料かつ制限なしでご利用いただけます ― 詳細についてはこちらをご覧ください。
免責事項
これらの情報および投稿は、TradingViewが提供または保証する金融、投資、取引、またはその他の種類のアドバイスや推奨を意図したものではなく、またそのようなものでもありません。詳しくは利用規約をご覧ください。