PROTECTED SOURCE SCRIPT
Pro Maker Prev Month Wick High/Low
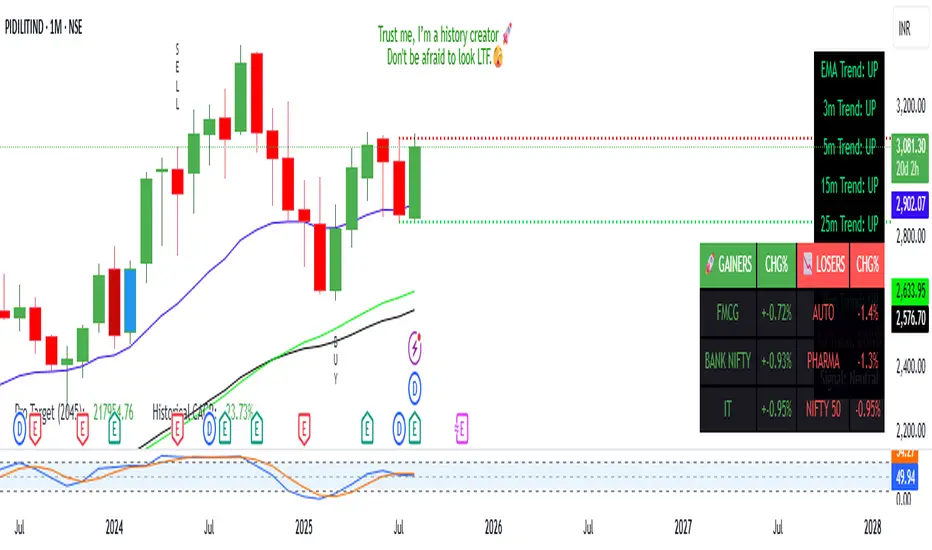
This indicator plots the exact Previous Month’s Wick High & Wick Low on the chart.
Levels are fixed across all timeframes (M1 to M).
High/Low lines start exactly from the first bar of the previous month and extend to the right.
Perfect for identifying important swing points and supply/demand zones.
Features:
Auto-updates at the start of a new month.
Works on any symbol & any timeframe.
Clean dotted-line visuals with color-coded High (Red) & Low (Green).
Use case:
Quickly see where the previous month’s extreme levels were.
Combine with price action or breakout strategies for higher accuracy.
保護スクリプト
このスクリプトのソースコードは非公開で投稿されています。 However, you can use it freely and without any limitations – learn more here.
免責事項
The information and publications are not meant to be, and do not constitute, financial, investment, trading, or other types of advice or recommendations supplied or endorsed by TradingView. Read more in the Terms of Use.