OPEN-SOURCE SCRIPT
更新済 ADL Price Ratio
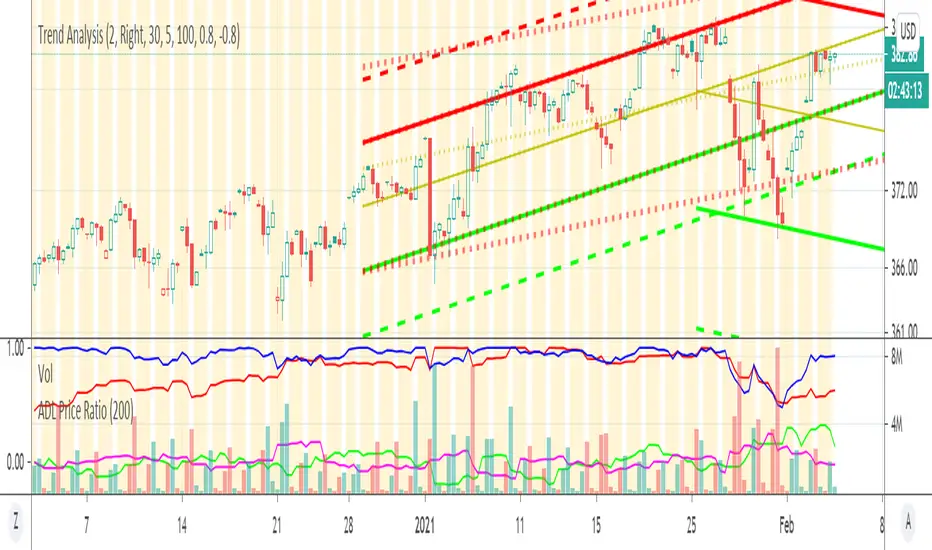
This script measures percentage of ADL movement relative and difference to Stock Price movement, in a core this measure reflects "how in-the-market (ADL) volume moves Stock Price".
The higher green line, the easier prices moves higher, the smaller black line (ADL - Price difference) the more price reflects volume movements (e.g. ADL up -> Stock Price up same amount)
The higher green line, the easier prices moves higher, the smaller black line (ADL - Price difference) the more price reflects volume movements (e.g. ADL up -> Stock Price up same amount)
リリースノート
- Removed moving averages which were cluttering chartリリースノート
Updated scenario when percent reaches 100% and thus difference with previous may be incorrect if ATH being hit continuously. As a result more accurate buyer/seller pressure on price is reflected (green vs magenta lines)On high level if green line (buyer AD moving price higher easily) higher than magenta (seller AD moving price down easily) and AD (red line) is going higher that means price moves higher on lower volume (ease of pressure to downward)
オープンソーススクリプト
TradingViewの精神に則り、このスクリプトの作者はコードをオープンソースとして公開してくれました。トレーダーが内容を確認・検証できるようにという配慮です。作者に拍手を送りましょう!無料で利用できますが、コードの再公開はハウスルールに従う必要があります。
免責事項
この情報および投稿は、TradingViewが提供または推奨する金融、投資、トレード、その他のアドバイスや推奨を意図するものではなく、それらを構成するものでもありません。詳細は利用規約をご覧ください。
オープンソーススクリプト
TradingViewの精神に則り、このスクリプトの作者はコードをオープンソースとして公開してくれました。トレーダーが内容を確認・検証できるようにという配慮です。作者に拍手を送りましょう!無料で利用できますが、コードの再公開はハウスルールに従う必要があります。
免責事項
この情報および投稿は、TradingViewが提供または推奨する金融、投資、トレード、その他のアドバイスや推奨を意図するものではなく、それらを構成するものでもありません。詳細は利用規約をご覧ください。